added 4 characters in body
Source Link
Yurii A
  • 121
  • 2

I'm trying to learn the concept of Pulse-density Modulation.

The wiki page gives a good overview and pseudocode of encoding procedure, but it lacks the decoding part:

The process of decoding a PDM signal into an analog one is simple: one only has to pass the PDM signal through a low-pass filter. This works because the function of a low-pass filter is essentially to average the signal. The average amplitude of pulses is measured by the density of those pulses over time, thus a low-pass filter is the only step required in the decoding process.

I'm trying to replicate the sine wave example and got quite stuck with the decoding part. I've tried convolving with Gaussian filter. The results are not great and also a bit impractical (since in order to restore the analog signal at time t I need to know the digital signal inresult depends on the futureparticular sigma and window size).

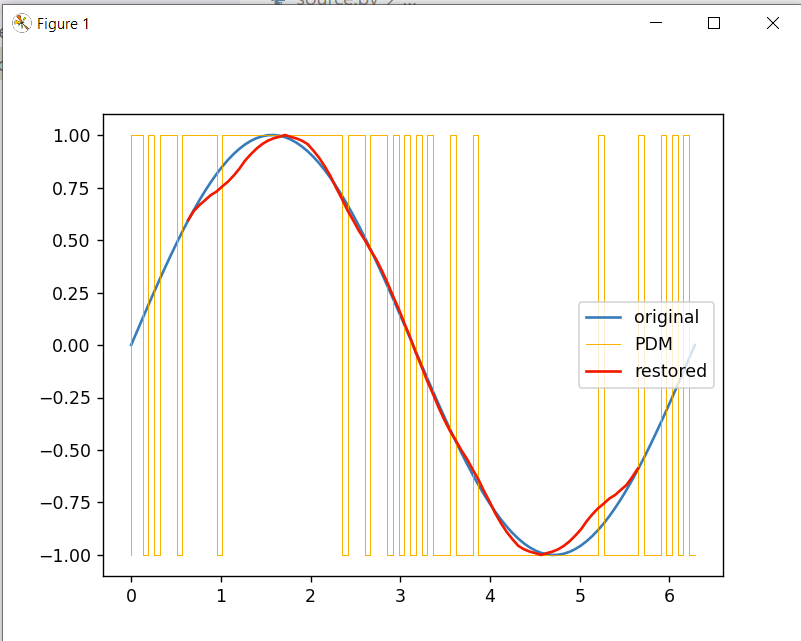
Here is the code I've written and how it looks:

import numpy as np
import matplotlib.pyplot as plt

N = 100
xs = np.linspace(0, 2 * np.pi, N)
ys = np.sin(xs)

def pdm(real_samples):
    res = []

    error = 0

    for item in real_samples:
        error += item
        res.append(-1 if error <= 0 else 1)
        error -= res[-1]

    return np.array(res)

def decode(encoded):
    n = len(encoded)
    res = np.zeros(n)

    t = 10
    sigma = 4

    ws = np.arange(-t, t + 1)
    w = np.exp(-((ws) ** 2) / (2 * sigma ** 2))
    w /= np.sum(w)

    xs = np.arange(t, n - t)
    for x in xs:
        res[x] = np.sum(encoded[x - t: x + t + 1] * w)

    res = res[t:n - t]

    return xs, res

encoded = pdm(ys)
decoded_xs, decoded = decode(encoded)
decoded_xs = xs[decoded_xs]

plt.figure()

plt.plot(xs, ys, label='original')
plt.step(xs, encoded, color='orange', linewidth=0.5, label='PDM')
plt.plot(decoded_xs, decoded, color='red', label='restored')

plt.legend()
plt.show()

Example output

Question: how do i properly restore the pulse density modulation encoded signal? What kind of low-pass filter should I use? And what cut-off frequency should I use?

I'm trying to learn the concept of Pulse-density Modulation.

The wiki page gives a good overview and pseudocode of encoding procedure, but it lacks the decoding part:

The process of decoding a PDM signal into an analog one is simple: one only has to pass the PDM signal through a low-pass filter. This works because the function of a low-pass filter is essentially to average the signal. The average amplitude of pulses is measured by the density of those pulses over time, thus a low-pass filter is the only step required in the decoding process.

I'm trying to replicate the sine wave example and got quite stuck with the decoding part. I've tried convolving with Gaussian filter. The results are not great and also a bit impractical (since in order to restore the analog signal at time t I need to know the digital signal in the future).

Here is the code I've written and how it looks:

import numpy as np
import matplotlib.pyplot as plt

N = 100
xs = np.linspace(0, 2 * np.pi, N)
ys = np.sin(xs)

def pdm(real_samples):
    res = []

    error = 0

    for item in real_samples:
        error += item
        res.append(-1 if error <= 0 else 1)
        error -= res[-1]

    return np.array(res)

def decode(encoded):
    n = len(encoded)
    res = np.zeros(n)

    t = 10
    sigma = 4

    ws = np.arange(-t, t + 1)
    w = np.exp(-((ws) ** 2) / (2 * sigma ** 2))
    w /= np.sum(w)

    xs = np.arange(t, n - t)
    for x in xs:
        res[x] = np.sum(encoded[x - t: x + t + 1] * w)

    res = res[t:n - t]

    return xs, res

encoded = pdm(ys)
decoded_xs, decoded = decode(encoded)
decoded_xs = xs[decoded_xs]

plt.figure()

plt.plot(xs, ys, label='original')
plt.step(xs, encoded, color='orange', linewidth=0.5, label='PDM')
plt.plot(decoded_xs, decoded, color='red', label='restored')

plt.legend()
plt.show()

Example output

Question: how do i properly restore the pulse density modulation encoded signal? What kind of low-pass filter should I use?

I'm trying to learn the concept of Pulse-density Modulation.

The wiki page gives a good overview and pseudocode of encoding procedure, but it lacks the decoding part:

The process of decoding a PDM signal into an analog one is simple: one only has to pass the PDM signal through a low-pass filter. This works because the function of a low-pass filter is essentially to average the signal. The average amplitude of pulses is measured by the density of those pulses over time, thus a low-pass filter is the only step required in the decoding process.

I'm trying to replicate the sine wave example and got quite stuck with the decoding part. I've tried convolving with Gaussian filter. The results are not great and also a bit impractical (since the result depends on the particular sigma and window size).

Here is the code I've written and how it looks:

import numpy as np
import matplotlib.pyplot as plt

N = 100
xs = np.linspace(0, 2 * np.pi, N)
ys = np.sin(xs)

def pdm(real_samples):
    res = []

    error = 0

    for item in real_samples:
        error += item
        res.append(-1 if error <= 0 else 1)
        error -= res[-1]

    return np.array(res)

def decode(encoded):
    n = len(encoded)
    res = np.zeros(n)

    t = 10
    sigma = 4

    ws = np.arange(-t, t + 1)
    w = np.exp(-((ws) ** 2) / (2 * sigma ** 2))
    w /= np.sum(w)

    xs = np.arange(t, n - t)
    for x in xs:
        res[x] = np.sum(encoded[x - t: x + t + 1] * w)

    res = res[t:n - t]

    return xs, res

encoded = pdm(ys)
decoded_xs, decoded = decode(encoded)
decoded_xs = xs[decoded_xs]

plt.figure()

plt.plot(xs, ys, label='original')
plt.step(xs, encoded, color='orange', linewidth=0.5, label='PDM')
plt.plot(decoded_xs, decoded, color='red', label='restored')

plt.legend()
plt.show()

Example output

Question: how do i properly restore the pulse density modulation encoded signal? What kind of low-pass filter should I use? And what cut-off frequency should I use?

Source Link
Yurii A
  • 121
  • 2

How should I decode Pulse Density Modulation signal?

I'm trying to learn the concept of Pulse-density Modulation.

The wiki page gives a good overview and pseudocode of encoding procedure, but it lacks the decoding part:

The process of decoding a PDM signal into an analog one is simple: one only has to pass the PDM signal through a low-pass filter. This works because the function of a low-pass filter is essentially to average the signal. The average amplitude of pulses is measured by the density of those pulses over time, thus a low-pass filter is the only step required in the decoding process.

I'm trying to replicate the sine wave example and got quite stuck with the decoding part. I've tried convolving with Gaussian filter. The results are not great and also a bit impractical (since in order to restore the analog signal at time t I need to know the digital signal in the future).

Here is the code I've written and how it looks:

import numpy as np
import matplotlib.pyplot as plt

N = 100
xs = np.linspace(0, 2 * np.pi, N)
ys = np.sin(xs)

def pdm(real_samples):
    res = []

    error = 0

    for item in real_samples:
        error += item
        res.append(-1 if error <= 0 else 1)
        error -= res[-1]

    return np.array(res)

def decode(encoded):
    n = len(encoded)
    res = np.zeros(n)

    t = 10
    sigma = 4

    ws = np.arange(-t, t + 1)
    w = np.exp(-((ws) ** 2) / (2 * sigma ** 2))
    w /= np.sum(w)

    xs = np.arange(t, n - t)
    for x in xs:
        res[x] = np.sum(encoded[x - t: x + t + 1] * w)

    res = res[t:n - t]

    return xs, res

encoded = pdm(ys)
decoded_xs, decoded = decode(encoded)
decoded_xs = xs[decoded_xs]

plt.figure()

plt.plot(xs, ys, label='original')
plt.step(xs, encoded, color='orange', linewidth=0.5, label='PDM')
plt.plot(decoded_xs, decoded, color='red', label='restored')

plt.legend()
plt.show()

Example output

Question: how do i properly restore the pulse density modulation encoded signal? What kind of low-pass filter should I use?