I am working on balancing an air-spindle. For the unbalance analysis I use an accelerometer (NI device). I have the voltage signal from the accelerometer corresponding to the vibration of spindle at a particular frequency (rpm) saved in an excel file. To analyze the unbalance from this vibration signal I use the "fft"fft function in MatlabMATLAB. My data is sampled at a sampling frequency of 100,000 Hz$100,000\textrm{ Hz}$. I am using the same example code given in the fftfft documentation. The result of fft is as shown. [![FFT Plot][1]][1]

FFT Plot.

The present signal consists of signals of various frequency. How can I filter this result in order to get only the signal of frequency equal to my rotational frequency (40Hz$40\textrm{ Hz}$).I I would need this signal to calculate the vibration phase and magnitude by comparing it with the tachometer signal. My MatlabMATLAB code looks like this:

%For vibration analysis of signal without any trial mass.

filename = '2400RPM.xlsx';
sheet = 1;
xlRange = 'C40:C516039';
x = xlsread(filename,sheet,xlRange);
T=1/100000;
L=length(x);
Fs=1/T;
t=(0:L-1)*T;
Y = fft(x);
mag1 = abs(Y/L);
mag = mag1(1:L/2+1);
mag(2:end-1) = 2*mag(2:end-1);
ph1 = rad2deg(Y/L);
ph = ph1(1:L/2+1);
ph(2:end-1) = 2*ph(2:end-1);
f=Fs*(0:(L/2))/L;

%PLOTTING RESULTS
%--------------------------------------

subplot(2,2,[1,2])
plot(t,x);
title('Vibration Signal: 2400RPM');
xlabel('Time (seconds)');
ylabel('Amplitude (voltage)');

subplot(2,2,3)
plot(f,mag);
title('Magnituge Plot');
xlabel('Frequency (Hz)');
ylabel('Amplitude');

subplot(2,2,4)
plot(f,ph);
title('Phase Plot');
xlabel('Frequency (Hz)');
ylabel('Phase (degree)');

Any help is much appreciated. [1]: https://i.sstatic.net/rIXxW.jpg

I am working on balancing an air-spindle. For the unbalance analysis I use an accelerometer (NI device). I have the voltage signal from the accelerometer corresponding to the vibration of spindle at a particular frequency (rpm) saved in an excel file. To analyze the unbalance from this vibration signal I use the "fft" function in Matlab. My data is sampled at a sampling frequency of 100,000 Hz. I am using the same example code given in the fft documentation. The result of fft is as shown. [![FFT Plot][1]][1].

The present signal consists of signals of various frequency. How can I filter this result in order to get only the signal of frequency equal to my rotational frequency (40Hz).I would need this signal to calculate the vibration phase and magnitude by comparing it with the tachometer signal. My Matlab code looks like this:

%For vibration analysis of signal without any trial mass.

filename = '2400RPM.xlsx';
sheet = 1;
xlRange = 'C40:C516039';
x = xlsread(filename,sheet,xlRange);
T=1/100000;
L=length(x);
Fs=1/T;
t=(0:L-1)*T;
Y = fft(x);
mag1 = abs(Y/L);
mag = mag1(1:L/2+1);
mag(2:end-1) = 2*mag(2:end-1);
ph1 = rad2deg(Y/L);
ph = ph1(1:L/2+1);
ph(2:end-1) = 2*ph(2:end-1);
f=Fs*(0:(L/2))/L;

%PLOTTING RESULTS
%--------------------------------------

subplot(2,2,[1,2])
plot(t,x);
title('Vibration Signal: 2400RPM');
xlabel('Time (seconds)');
ylabel('Amplitude (voltage)');

subplot(2,2,3)
plot(f,mag);
title('Magnituge Plot');
xlabel('Frequency (Hz)');
ylabel('Amplitude');

subplot(2,2,4)
plot(f,ph);
title('Phase Plot');
xlabel('Frequency (Hz)');
ylabel('Phase (degree)');

Any help is much appreciated. [1]: https://i.sstatic.net/rIXxW.jpg
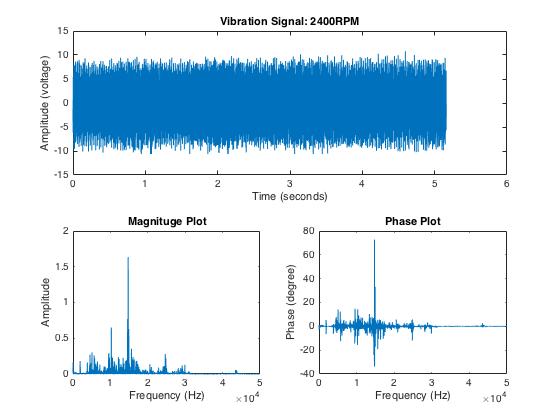
I am working on balancing an air-spindle. For the unbalance analysis I use an accelerometer (NI device). I have the voltage signal from the accelerometer corresponding to the vibration of spindle at a particular frequency (rpm) saved in an excel file. To analyze the unbalance from this vibration signal I use the fft function in MATLAB. My data is sampled at a sampling frequency of $100,000\textrm{ Hz}$. I am using the same example code given in the fft documentation. The result of fft is as shown.

FFT Plot.

The present signal consists of signals of various frequency. How can I filter this result in order to get only the signal of frequency equal to my rotational frequency ($40\textrm{ Hz}$). I would need this signal to calculate the vibration phase and magnitude by comparing it with the tachometer signal. My MATLAB code looks like this:

%For vibration analysis of signal without any trial mass.

filename = '2400RPM.xlsx';
sheet = 1;
xlRange = 'C40:C516039';
x = xlsread(filename,sheet,xlRange);
T=1/100000;
L=length(x);
Fs=1/T;
t=(0:L-1)*T;
Y = fft(x);
mag1 = abs(Y/L);
mag = mag1(1:L/2+1);
mag(2:end-1) = 2*mag(2:end-1);
ph1 = rad2deg(Y/L);
ph = ph1(1:L/2+1);
ph(2:end-1) = 2*ph(2:end-1);
f=Fs*(0:(L/2))/L;

%PLOTTING RESULTS
%--------------------------------------

subplot(2,2,[1,2])
plot(t,x);
title('Vibration Signal: 2400RPM');
xlabel('Time (seconds)');
ylabel('Amplitude (voltage)');

subplot(2,2,3)
plot(f,mag);
title('Magnituge Plot');
xlabel('Frequency (Hz)');
ylabel('Amplitude');

subplot(2,2,4)
plot(f,ph);
title('Phase Plot');
xlabel('Frequency (Hz)');
ylabel('Phase (degree)');

Any help is much appreciated.

Source Link

FFT analysis for Vibration Signal

I am working on balancing an air-spindle. For the unbalance analysis I use an accelerometer (NI device). I have the voltage signal from the accelerometer corresponding to the vibration of spindle at a particular frequency (rpm) saved in an excel file. To analyze the unbalance from this vibration signal I use the "fft" function in Matlab. My data is sampled at a sampling frequency of 100,000 Hz. I am using the same example code given in the fft documentation. The result of fft is as shown. [![FFT Plot][1]][1].

The present signal consists of signals of various frequency. How can I filter this result in order to get only the signal of frequency equal to my rotational frequency (40Hz).I would need this signal to calculate the vibration phase and magnitude by comparing it with the tachometer signal. My Matlab code looks like this:

%For vibration analysis of signal without any trial mass.

filename = '2400RPM.xlsx';
sheet = 1;
xlRange = 'C40:C516039';
x = xlsread(filename,sheet,xlRange);
T=1/100000;
L=length(x);
Fs=1/T;
t=(0:L-1)*T;
Y = fft(x);
mag1 = abs(Y/L);
mag = mag1(1:L/2+1);
mag(2:end-1) = 2*mag(2:end-1);
ph1 = rad2deg(Y/L);
ph = ph1(1:L/2+1);
ph(2:end-1) = 2*ph(2:end-1);
f=Fs*(0:(L/2))/L;

%PLOTTING RESULTS
%--------------------------------------

subplot(2,2,[1,2])
plot(t,x);
title('Vibration Signal: 2400RPM');
xlabel('Time (seconds)');
ylabel('Amplitude (voltage)');

subplot(2,2,3)
plot(f,mag);
title('Magnituge Plot');
xlabel('Frequency (Hz)');
ylabel('Amplitude');

subplot(2,2,4)
plot(f,ph);
title('Phase Plot');
xlabel('Frequency (Hz)');
ylabel('Phase (degree)');

Any help is much appreciated. [1]: https://i.sstatic.net/rIXxW.jpg