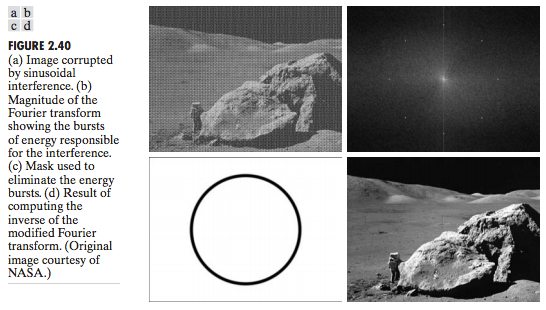
I'm a statistics grad student, and I just started getting into Digital-Image-Processing (an analogy for processing super-large contingency tables). In the book "Digital Image Processing" by Gonzalez and Woods, I was reading chapter 2, page 94 of the third edition, and found the following image that is MAGIC to me...
They begin with a noisy image, identify some 'hot points' surrounding the center of the Fourier transform, then simply remove them, reverse the transform, and I can't help vocally demonstrate an emotional reaction while assessing that the image is now crystal clear.
Does anyone have any insight into this? Are there any statistical approaches that can be used I'd like to test a hypothesis that these 'hot points'know what are in fact interference? Are there other interesting approachesthe underlying notions and methods used to analyzing these transforms statistically ?filter this image.
IfAdditionally, if any of the StackExchange users a familiar with this topic and can suggest some articles/books that I might read, I would be very grateful.

