broken image fixed (click 'rendered output' to see the difference); for more info, see https://gist.github.com/Glorfindel83/9d954d34385d2ac2597bbe864466259f
Source Link

This is a continuation of the discussion here. I would comment there, but I don't have 50 rep so I'm asking a new question.

Here's how I understand the DCT step in the MFCC calculation process: The rationale behind it is to separate the correlation in the log-spectral magnitudes (from the filterbank) due to the overlapping of the filters. Essentially, the DCT smooths the spectrum representation given by these log-spectral magnitudes.

Would it be correct to say that the blue line in the image below represents the spectrum as represented by the vector of log-spectral magnitudes, and the red line is that vector once its been DCT-ified?

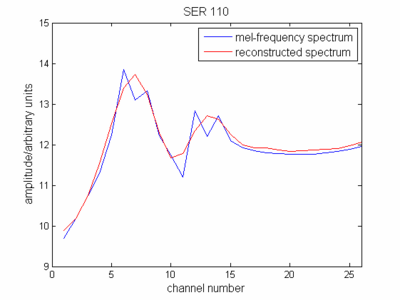
DCT-ified log-spectral magnitudes (i.e. MFCCs) vs. merely log-spectral magnitudes??? http://www.acousticscale.org/wiki/images/thumb/3/36/Mfcc_fig4.png/400px-Mfcc_fig4.pngDCT-ified log-spectral magnitudes (i.e. MFCCs) vs. merely log-spectral magnitudes???

This is a continuation of the discussion here. I would comment there, but I don't have 50 rep so I'm asking a new question.

Here's how I understand the DCT step in the MFCC calculation process: The rationale behind it is to separate the correlation in the log-spectral magnitudes (from the filterbank) due to the overlapping of the filters. Essentially, the DCT smooths the spectrum representation given by these log-spectral magnitudes.

Would it be correct to say that the blue line in the image below represents the spectrum as represented by the vector of log-spectral magnitudes, and the red line is that vector once its been DCT-ified?

DCT-ified log-spectral magnitudes (i.e. MFCCs) vs. merely log-spectral magnitudes??? http://www.acousticscale.org/wiki/images/thumb/3/36/Mfcc_fig4.png/400px-Mfcc_fig4.png

This is a continuation of the discussion here. I would comment there, but I don't have 50 rep so I'm asking a new question.

Here's how I understand the DCT step in the MFCC calculation process: The rationale behind it is to separate the correlation in the log-spectral magnitudes (from the filterbank) due to the overlapping of the filters. Essentially, the DCT smooths the spectrum representation given by these log-spectral magnitudes.

Would it be correct to say that the blue line in the image below represents the spectrum as represented by the vector of log-spectral magnitudes, and the red line is that vector once its been DCT-ified?

DCT-ified log-spectral magnitudes (i.e. MFCCs) vs. merely log-spectral magnitudes???

replaced http://dsp.stackexchange.com/ with https://dsp.stackexchange.com/
Source Link

This is a continuation of the discussion herethe discussion here. I would comment there, but I don't have 50 rep so I'm asking a new question.

Here's how I understand the DCT step in the MFCC calculation process: The rationale behind it is to separate the correlation in the log-spectral magnitudes (from the filterbank) due to the overlapping of the filters. Essentially, the DCT smooths the spectrum representation given by these log-spectral magnitudes.

Would it be correct to say that the blue line in the image below represents the spectrum as represented by the vector of log-spectral magnitudes, and the red line is that vector once its been DCT-ified?

DCT-ified log-spectral magnitudes (i.e. MFCCs) vs. merely log-spectral magnitudes??? http://www.acousticscale.org/wiki/images/thumb/3/36/Mfcc_fig4.png/400px-Mfcc_fig4.png

This is a continuation of the discussion here. I would comment there, but I don't have 50 rep so I'm asking a new question.

Here's how I understand the DCT step in the MFCC calculation process: The rationale behind it is to separate the correlation in the log-spectral magnitudes (from the filterbank) due to the overlapping of the filters. Essentially, the DCT smooths the spectrum representation given by these log-spectral magnitudes.

Would it be correct to say that the blue line in the image below represents the spectrum as represented by the vector of log-spectral magnitudes, and the red line is that vector once its been DCT-ified?

DCT-ified log-spectral magnitudes (i.e. MFCCs) vs. merely log-spectral magnitudes??? http://www.acousticscale.org/wiki/images/thumb/3/36/Mfcc_fig4.png/400px-Mfcc_fig4.png

Tweeted twitter.com/#!/StackSignals/status/461562466112389120
Source Link
orangebanana3
  • 245
  • 1
  • 2
  • 5

Is this a correct interpretation of the DCT step in MFCC calculation?

This is a continuation of the discussion here. I would comment there, but I don't have 50 rep so I'm asking a new question.

Here's how I understand the DCT step in the MFCC calculation process: The rationale behind it is to separate the correlation in the log-spectral magnitudes (from the filterbank) due to the overlapping of the filters. Essentially, the DCT smooths the spectrum representation given by these log-spectral magnitudes.

Would it be correct to say that the blue line in the image below represents the spectrum as represented by the vector of log-spectral magnitudes, and the red line is that vector once its been DCT-ified?

DCT-ified log-spectral magnitudes (i.e. MFCCs) vs. merely log-spectral magnitudes??? http://www.acousticscale.org/wiki/images/thumb/3/36/Mfcc_fig4.png/400px-Mfcc_fig4.png