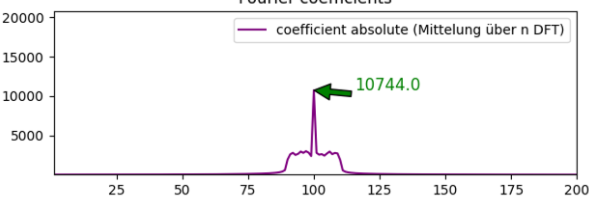
It appears from a subsequent update that the OP may be making multiple experimental tests and tracking the mean of the magnitude of the DFT bin with noise added. This statistic is Ricean distributed, and the details of how the mean relates to the variance of the noise for that process are detailed here: https://en.wikipedia.org/wiki/Rice_distribution.
However, to validate the noise process is as expected, I suggest not taking the magnitude of the DFT and averaging the magnitudes of the tones, but instead simply taking the standard deviation or variance of those complex samples directly (the complex value for the tones).
Below are the results we would expect for white noise. Also from the OP's plots it appears the noise is band-limited white noise. This additional detail is covered at the end of this post as it is helpful to understand my given explanations first.
Assuming we have a real tone given as:
$$x[n] = A\cos(2\pi k n/N)$$
Where $k$ is the frequency index as an integer with $0\le k < N$.
Prior to adding noise, when we compute the DFT (without further windowing), if $k\ne0$, the DFT result we will be zero for all bins except bins $k$ and $N-k$.
If we add white noise to the time domain signal (white means every sample is independent and identically distributed) with variance $\sigma^2$, the resulting magnitude of the bins with the tone and variance will depend on how we scale the DFT. The three most popular scales are no scaling, scaling by $1/N$, and scaling by $1/\sqrt{N}$. Each would have a resulting DFT tone magnitude and variance as follows assuming two-sided spectrums that extend from $k=0$ to $k=N-1$ (includes both positive and negative frequencies):
No Scaling:
$$X[k]= \sum_{n=0}^{N-1}x[n]e^{-j 2\pi nk/N}$$
Magnitude of tone in DFT (at bins $k$ and $N-k$): $NA/2$
Variance of each bin: $N\sigma^2$
$1/N$ Scaling:
$$X[k]= \frac{1}{N}\sum_{n=0}^{N-1}x[n]e^{-j 2\pi nk/N}$$
Magnitude of tone in DFT (at bins $k$ and $N-k$): $A/2$
Variance of each bin: $\sigma^2/N$
$1/\sqrt{N}$ Scaling:
$$X[k]= \frac{1}{\sqrt{N}}\sum_{n=0}^{N-1}x[n]e^{-j 2\pi nk/N}$$
Magnitude of tone in DFT (at bins $k$ and $N-k$): $\sqrt{N}A/2$
Variance of each bin: $\sigma^2$
Details
Each bin in the FFT is effectively a bandpass filter (and for the unwindowed FFT the filter response in the frequency domain is the Dirichlet Kernel which is essentially an aliased Sinc Function). Conveniently for white noise, the equivalent noise bandwidth of the Dirichlet Kernel is that of a brickwall filter 1 bin wide. The scaling of the DFT by $1/\sqrt{N}$ is consistent with Parseval’s theorem:
$$X[k]= \frac{1}{\sqrt{N}}\sum_{n=0}^{N-1}x[n]e^{-j 2\pi nk/N}$$
For this scaling, the variance for each bin (which is the total noise power in the signal divided by the total number of bins) will go down as $1/N$ when the noise is white (the noise is evenly spread over all frequencies, and we have $N$ bins, so the noise in one bin is $1/N$ in power). Similarly, the standard deviation will be $1/\sqrt{N}$. In the bin where a tone exists (and to simplify the explanation without involving spectral leakage, let's assume the tone is exactly at a bin center), the FFT result will be the perfect tone +/- the standard deviation as $\sigma/\sqrt{N}$ where $\sigma$ is the standard deviation of the noise. This could be confirmed by repeating the experiment many times with independent and identically distributed zero-mean stationary white noise, as we would do for other experimental measurements to establish a noise statistic. Ultimately the noise variation we see on the peak is identical to the noise variation we see on every other bin (without the offset due to the tone present on bin center). So we can also confirm the noise on the peak by using the statistics from the variation we see for every other bin (again and importantly under this contrived case of not inducing spectral leakage from the tone to other bins by ensuring the tone is exactly on bin center).
Effect of Bandlimiting the Noise
The OP has shown a plot that looks as follows:
From this we see that the noise is not white, but bandlimited around the tone of interest. If we assume that the noise extends evenly over $M$ bins out of the $N$ bins total and has a total variance of $\sigma^2$, then the variance in each of the bins where the noise is present (including the tone bin) would be $\sigma^2/M$ instead of $\sigma^2/N$ (assuming we scale the DFT by $1/\sqrt{N}$).
For more details on the filter bank view of the FFT, see DSP.SE #66299.

