Effects of Averaging
Using a moving average filter will smooth out the irregularities in the signal. The noise becomes E/N where N is the length of the moving average filter. The side effect of using a MA is that the signal peaks become wider and shallower.
In addition, the frequency content of the signal will change. A moving average filter in the time domain is the same thing as convolving the frequency domain signal by a sinc function everything gets smudged out.
Peak Detection Algorithm
Peak detection is a common problem in 9/10 engineering problems. (not really, but a TON depend on them)
Typically this is what is done:
Median Thresholding
1) Look for all peaks in your signal. (i.e., a point that is larger than the two
   adjacent points
2) take this list of points and for each one of them compute:
   med_threshold = median(Peak,Width) + constantThresholmedian   where median is the
   median value of the data centered at "Peak" with Width being the number of
   points to look at.
       a) The Width(usually written as Lambda in literature) and constantThreshold
          (usually written as C) are determined by trial and error and using the ROC
          curve (Acronym below)
3) if the peak's magnitude is above this threshold accept it as a true peak.
   Else: Discard it, its a false peak
4) Generate a Receiver Operating Characteristic Curve(ROC) to how well the algorithm
   is performing.
Here is an example:
suppose we have the signal X = [ 0 0 0 0 1 3 **9** 2 1 1 **2** 1 1 ]
1) 9 and 2 are both potential peaks
2) Lets use a window of 5 and  a threshold =2
so at 9 we have [1 3 9 1 2] -> [1 1 2 3 9]  so Median(9,5) = 2
9 > 2 +2, therefor its a peak
Lets take a look at 2: [ 1 1 2 1 1] -> [1 1 1 1 2 ] Median(2,5) = 1
2 < 1+2, therefor it is NOT a peak.
Determining Frequency
Now that You've effectively found the time localization of the peak try to find their frequency:
1) Use the locations of the peaks to generate a pulse train
      a) this means create sum(Dirac_delta[t-L(n)]) where L(n) is the nth time that
      you've localized through median thresholding
2) Apply FFT Algorithm
3) Look for largest peak.
Alternate Frequency Estimation
1) Think of this like a beat in a piece of music (I learned about thresholding by
   researching Onset Detection.
2) Compute the average time distance between detected peaks.
3) now call your results BPM or PPM (pulses per minute)
Additional Avenues of Research
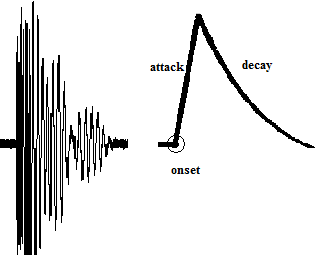
While you may be satisfied by the peaked signal as is, there are algorithms that are applied to a whole different beast of problems called Onset Detection.
Onset Detection is a big area in Music Information Retrieval Research. Its used to determine when a note is being played.

If you think of your tape head signal as a highly sampled signal, you can apply many of the algorithms that you would find in this paper:
http://www.elec.qmul.ac.uk/people/juan/Documents/Bello-TSAP-2005.pdf


