I've been reading that to increase the frequency resolution of the DFT of a signal, you can add 0s at the end of the signal. But why is this the case? Why don't you add 0s in front of the signal instead? What differences does it make?
-
2$\begingroup$ Are you familiar with the properties of the DFT? specifically the delay property? The front padded signal is a delayed version of the back padded one, i.e. $x_{front}[n] = x_{back}[n]*\delta[n-N_{pad}]$ where '* is circular convolution. You should be able to work out the spectral difference from there. $\endgroup$– HilmarCommented May 27 at 12:08
2 Answers
What differences does it make?
In one line - The phase information of the Fourier transform changes.
Explanation:
Adding zeros at the start of the signal translates to adding delay.
Consider the signal $x[n]$. Let $L$ be the original length of the signal. If $N$ zeros are appended at the start of the signal then the resulting signal $y[n]$ can be represented as below: $$y[n] = 0\ for\ 0<=n<N $$ $$y[n] = x[n - N]\ for\ N <= n < (N + L) $$
Consider that $X[k]$ is the DFT (for length $L' = L + N$) of $x[n]$, then the DFT of $y[n]$ will be $X[k] * e^{\frac{j2 \pi Nk}{L'}}$. As can be seen, the additional factor $e^{\frac{j2 \pi Nk}{L'}}$ changes the phase information of the DFT and the phase change is related to the delay / number of zeros added at the start $N$.
The frequency resolution in the context of the DFT is indeed dependent on the length of the signal in the time domain, not merely the size of the DFT. Here’s a more detailed explanation:
- Frequency Resolution: The frequency resolution $\Delta f$ is determined by the sampling interval $T$ and the total length of the signal $NT$, where $N$ is the number of samples. Mathematically, $\Delta f = \frac{1}{NT}$. This means that the longer the time duration of the signal, the finer the frequency resolution.
- DFT Size and Zero Padding: The size of the DFT (number of points $N$) does influence the number of frequency bins but does not inherently change the frequency resolution. Zero padding a signal (adding zeros to increase the number of points $N$ before taking the DFT) increases the number of frequency bins but does not improve the inherent frequency resolution. It can, however, provide a smoother-looking spectrum and better visualization.
- Practical Implications: To achieve higher frequency resolution, one should increase the observation time (recording duration of the signal). Simply increasing the DFT size by zero padding does not enhance the frequency resolution; it only interpolates additional points between existing frequency bins.
Understanding this distinction is important in applications like spectral analysis, where distinguishing between closely spaced frequency components is necessary.
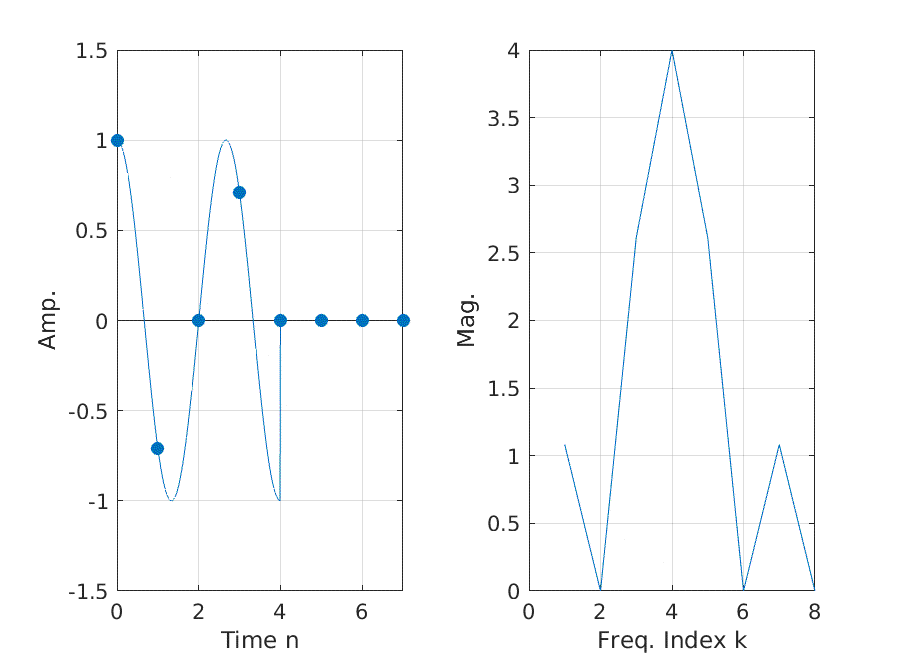
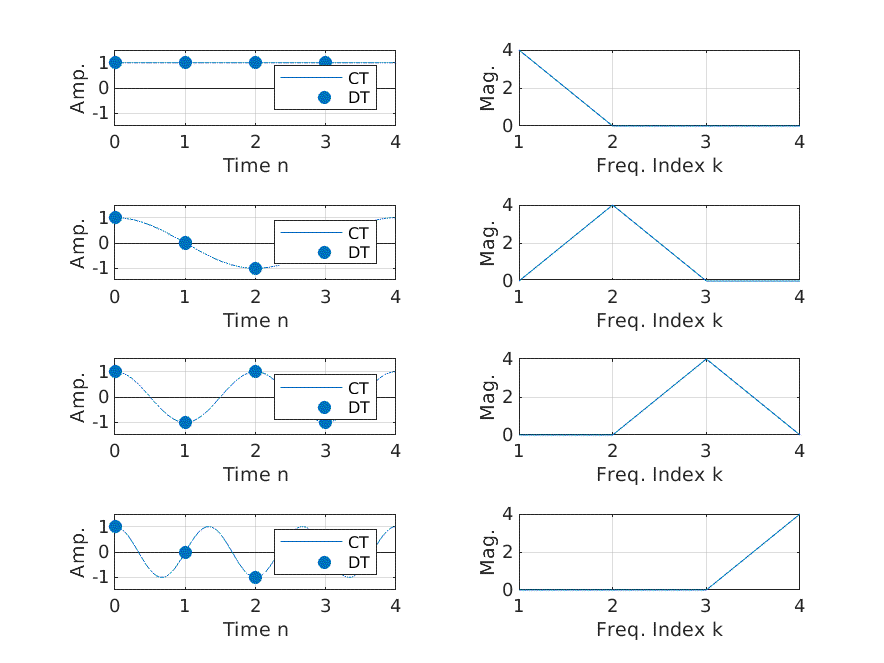
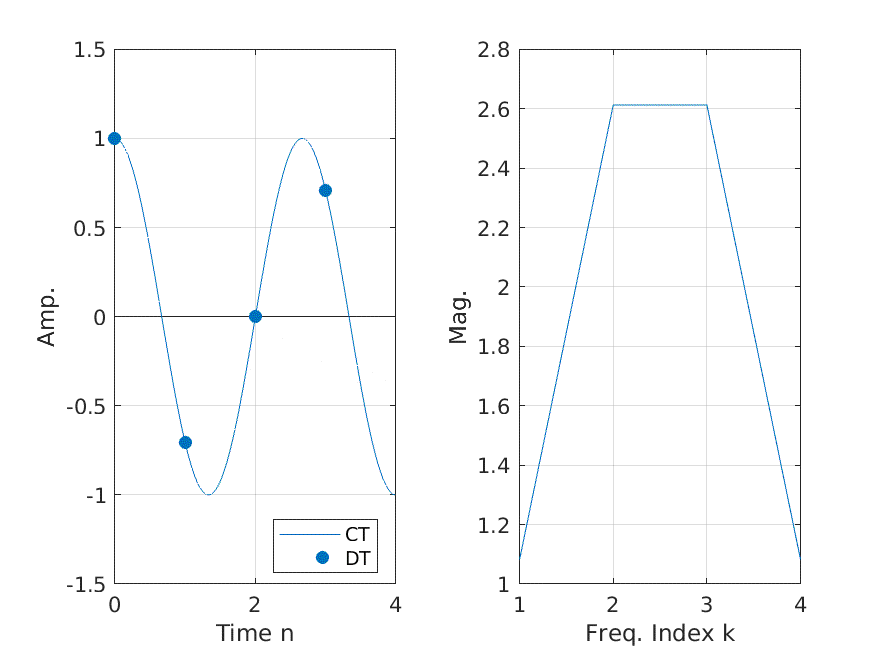
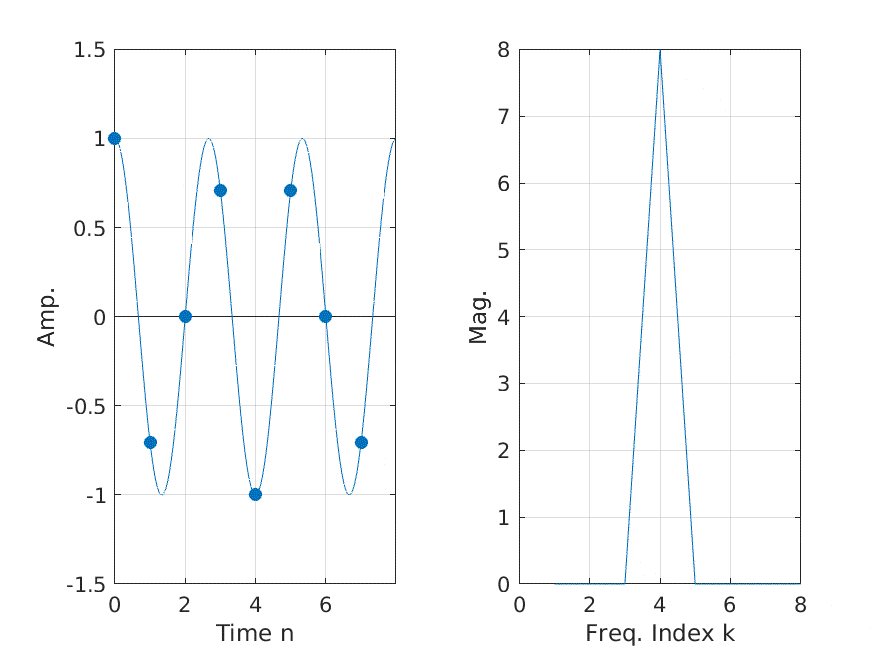
The MATLAB code below illustrates the effect of zeropadding and that of increasing observation duration
%% DFT: Frequency Resolution and Zeropadding

clc,clear,close all

%% Parameters
fs = 100;
fc = 1/4;
T = 1/fc;

%% Continuous Signal
t = (0:1/fs:T-1/fs)'; % time
xc = exp(1i*2*pi*((0:3)*fc).*t); % Continuous-time signal

%% Discrete-Time Signals (On-Grid Signals)
n = (0:T-1)'; % discrete time index
xd = exp(1i*2*pi*((0:3)*fc).*n); % Discrete-time signal

%% On-Grid Signals & Frequency Resolution
NFFT = 4; % Number of DFT points
Xd = fft(xd,NFFT,1);

figure
tiledlayout(4,2)

for i = 1:4
    nexttile
    h = plot(t,real(xc(:,i)));
    hold("on")
    stem(n,real(xd(:,i)),"o","filled",LineStyle="none",Color=h.Color)
    ylim([-1.5,1.5])
    xlabel("Time n")
    ylabel("Amp.")
    legend(["CT","DT"],Location="best")
    grid("on")

    nexttile
    plot(1:NFFT,abs(Xd(:,i)))
    xlabel("Freq. Index k")
    ylabel("Mag.")
    grid("on")
end
%% Off-Grid Signals & Frequency Resolution
% Frequency not on DFT grid, thus there is a leakage between DFT bins
fcp = 1.5*fc;
xpc = exp(1i*2*pi*fcp*t); % Continuous-time signal
xpd = exp(1i*2*pi*fcp*n); % Discrete-time signal
Xpd = fft(xpd,NFFT,1);

figure
tiledlayout(1,2)
nexttile
h = plot(t,real(xpc));
hold("on")
stem(n,real(xpd),"o","filled", ...
    LineStyle="none", ...
    Color=h.Color)
ylim([-1.5,1.5])
xlabel("Time n")
ylabel("Amp.")
legend(["CT","DT"],Location="best")
grid("on")

nexttile
plot(1:NFFT,abs(Xpd))
xlabel("Freq. Index k")
ylabel("Mag.")
grid("on")
%% Zero-Padding
% Now lets investigate the impact of zeropadding
NFFT = 8;
xpcz = paddata(xpc,length(xpc)+NFFT);
xpdz = paddata(xpd,NFFT);
Xpdz = fft(xpdz,NFFT,1);

figure
tiledlayout(1,2)

nexttile
h = plot((0:length(xpcz)-1)/fs,real(xpcz));
hold on
stem((0:length(xpdz)-1),real(xpdz),"o","filled", ...
    LineStyle="none", ...
    Color=h.Color)
ylim([-1.5,1.5])
xlabel("Time n")
ylabel("Amp.")
grid

nexttile
plot(1:NFFT,abs(Xpdz))
xlabel("Freq. Index k")
ylabel("Mag.")
grid("on")
 As observed in this figure, still there are leakages even with zero padding.
%% Observation Duration
% Now lets increase the signal length and see its impact on DFT

T2 = 2/fc; % Duration of observation is twice the original length we start with
n2 = (0:T2-1)'; % discrete time index
t2 = (0:1/fs:T2-1/fs)'; % time

xp2 = exp(1i*2*pi*fcp*t2); % Continuous-time signal
xpd2 = exp(1i*2*pi*fcp.*n2); % Discrete-time signal
Xpd2 = fft(xpd2,[],1);

figure
tiledlayout(1,2)

nexttile
h = plot((0:length(xp2)-1)/fs,real(xp2));
hold on
stem(n2,real(xpd2),"o","filled",LineStyle="none",Color=h.Color)
ylim([-1.5,1.5])
xlabel("Time n")
ylabel("Amp.")
grid("on")

nexttile
plot((1:length(Xpd2)),abs(Xpd2))
xlabel("Freq. Index k")
ylabel("Mag.")
grid("on")
Note that adding $N_{\tau} = \tau f_s$ zeros in the beginning delays the signal by $N_{\tau}$ samples in the time domain, thus, in the frequency domain ${\cal{F}}\{x(t-\tau)\}(\xi) = e^{-2\pi i\tau\xi}{\cal{F}}\{x(t)\}(\xi)$ it introduces a phase shift in frequency domain.


