I won't provide the CC++ implementation, but hopefully the following details in Python can be used for validation and direction for the approach to use.
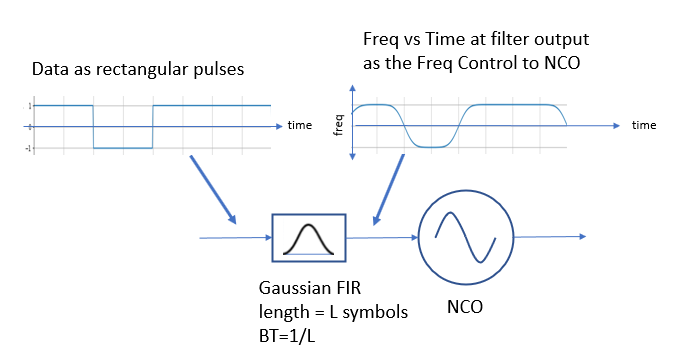
GMSK is implemented as data given as rectangular pulses filtered with a Gaussian filter. The output of the Gaussian filter is proportional to frequency versus time, so can then be scaled and used as the frequency control word input into a numerically controlled oscillator (NCO) to produce a GMSK waveform prior to up-conversion to a particular carrier frequency.

The duration (or memory) of the Gaussian filter is the inverse of the bandwidth-time product (BT). When BT=1, the filter concludes it's impulse response for every symbol just prior to the start of the next symbol, and thus there is no overlap between symbols. This is referred to as "Full-Response Signaling". When BT<1, the impulse response from one symbol overlaps into the subsequent symbols, and thus there is an intentional inter-symbol-interference (ISI) resulting in greater spectral efficiency at the expense of receiver complexity. For the OP's case, BT=0.4, and the impulse response for each symbol lasts for 2.5 symbols.
Below is my simulation for comparison of the expected result using the OP's design parameters:
BT = 0.4 Bandwidth-Time Product
f_s = 2 MHz Sampling Rate
R = 9600 Data Rate
Example Data Pattern:

I used the following code in Python to generate the filter.
def gpulse(ts, bt, fs):
    '''
    Returns coefficients for gaussian pulse filter
    ts: symbol period
    bt: bandwidth-time product
    fs: sampling rate

    GMSK is implemented with data as rectangular pulses into filter
    with output of filter representing frequency vs time
    (as input to NCO or VCO after scaling based on NCO/VCO used)

    Dan Boschen 5/26/2024
    '''
    sigma = np.sqrt(np.log(2))/(2*np.pi*bt)
    t = np.arange( int(ts * fs / bt) ) / fs - ts/(2 * bt)
    h = 1 / (np.sqrt(2*np.pi) * sigma * ts) * np.exp(-t**2 / (2 * sigma**2 * ts**2))
    return  h / fs  # scaled for 0 dB gain
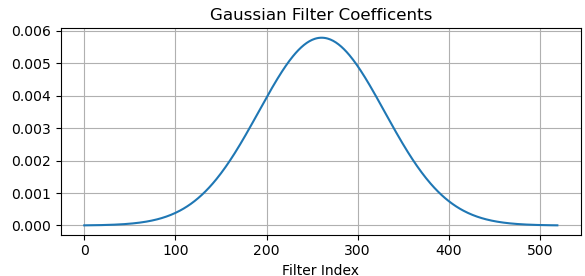
The plot below is the Gaussian filter coefficients when using the OP's parameters:

Importantly note that given the OP's sample rate and data rate, the duration of the above filter is exactly 2.5 symbols (inverse of the bandwidth-time product).
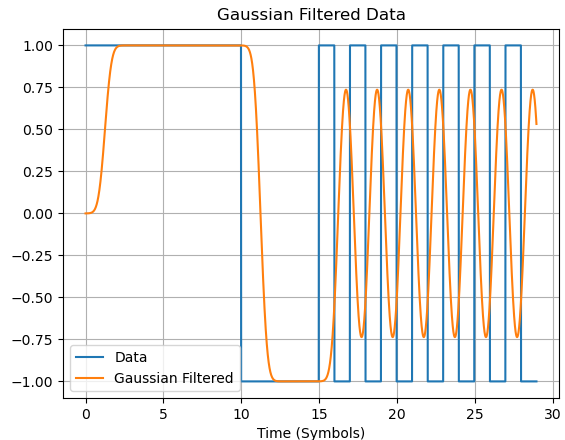
The resulting output of the filter with the test sequence used is plotted below. Note the waveform into the filter consists of rectangular pulses mapped to +1 or -1, and the filter has been normalized for 0 dB gain. The scaling of the filter output corresponding to the frequency of the transmitted carrier is $R/4$ where $R$ is the data rate. We also see the effect of the expected filter delay in the resulting filter output.

The Python code used to generate the filtered data is below:
bt = .4
fs = 2e6
data_rate = 9600
ts = 1/data_rate                          # symbol period (seconds)
t = np.arange(nsyms * Ts * fs)/fs - nsyms * Ts/2
rect = np.ones(int(fs * Ts))
data = np.array([1,1,1,1,1,1,1,1,1,1,-1,-1,-1,-1,-1,1,-1,1,-1,1,-1,1,-1,1,-1,1,-1,1,-1])
symbol = np.ones( (int(fs/data_rate),len(data)) )
pulses = (symbol*data).T.flatten()

coeff = gpulse(ts, bt, fs)
filtered_data = sig.lfilter(coeff,1, pulses)
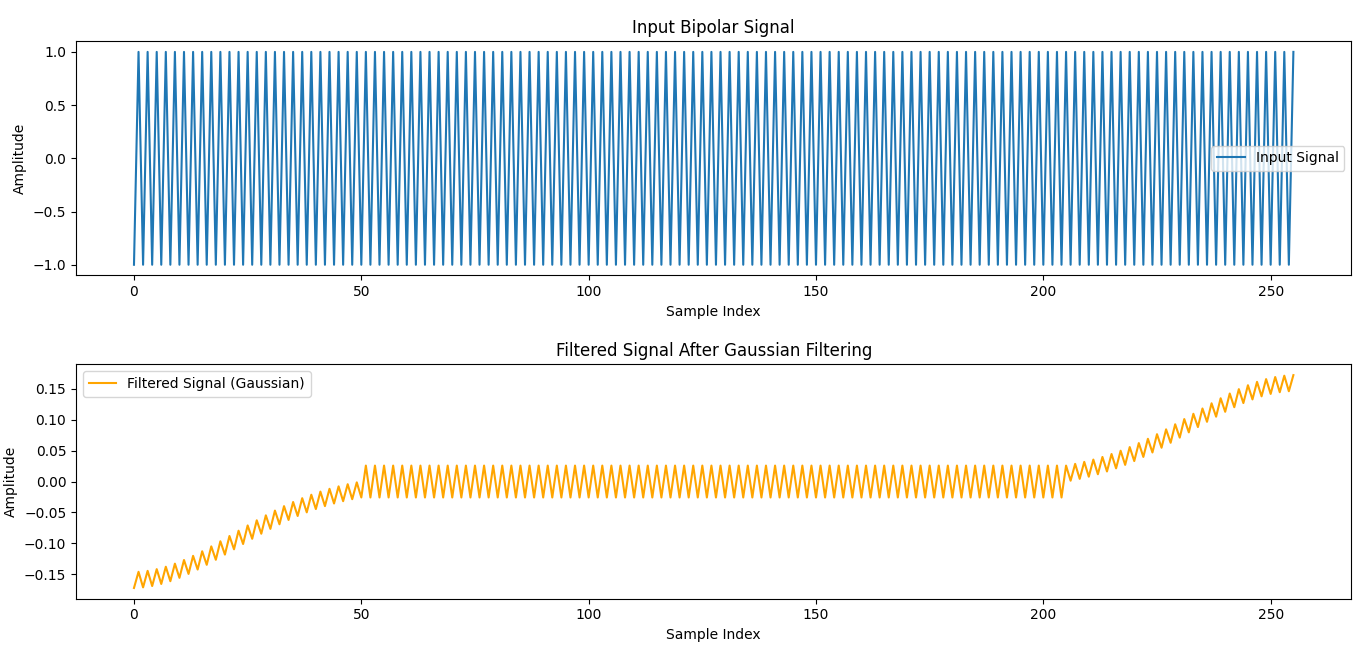
 I need expert advice on implementation of Gaussian Pulse Shaping filter for generating GMSK signal in further steps. I have implemented as follows, Can anyone confirm that the Pulse would be shaped as desired by the Gaussian Pulse Shaping filter. The output is triangular not desired. I have used 256 bipolar values with BT=0.4, sample rate= 2 MSPS, data rate=9600 bps. I was not able to find implementation in C/ C++. Can anyone provide me the correct source code. I don't want to use any library. Thanks


