1
$\begingroup$

I again need your help. You were already nicely able to help with predicting the signal I'm dealing with. Thanks a lot. (Forecasting of a periodic movement based on sensor data)

Now I need to remove to effects from the sampling. Unfortunately I don't really have back ground in signal processing

The signal is sampled motion data from a rotating, periodic movement. Once setup the speed of the movement does not change much. I did a time domain auto correlation to find the periodicity/frequency of the signal.

Now I've the problem that this signal is used to render an animation. The sampling artifacts from the hall sensor cause the rendering not being fully smooth.

The data file and the Octave script to process it are in this folder.

What would be good approach in Octave? A few (max 5 ms) of delay caused by the filter should be acceptable.

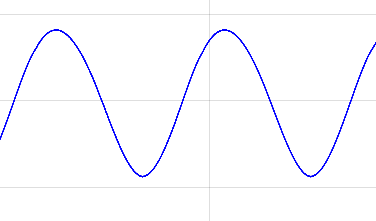
The filters I tried unfortunately didn't have an effect or resulted in distorted data. Over all signal:

enter image description here

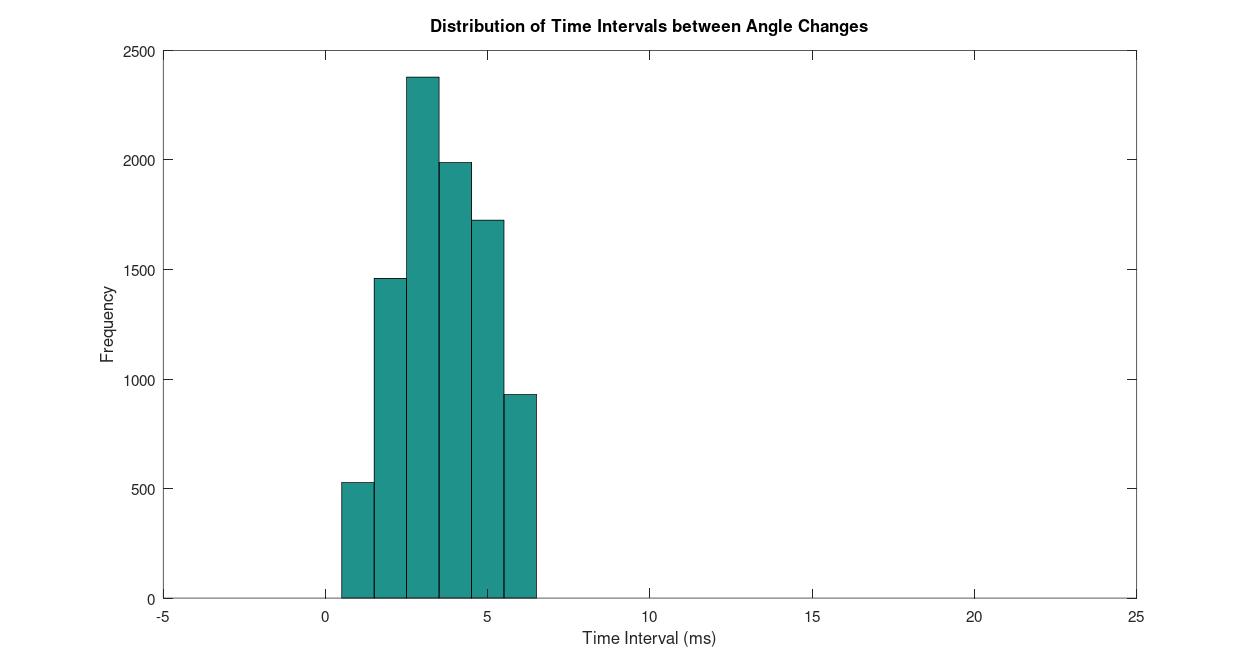
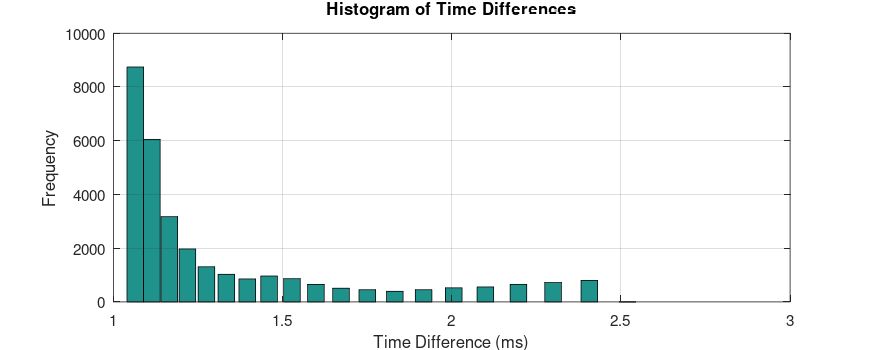
The data from the sensor is read at the highest possible rate and subject to jitter, resulting in not evenly spaced samples, largely around 1 ms. Also this will not be the "true" sampling rate of the sensor. In many cases the same value is read multiple times. Getting the full E2E sampling rate may not be straight forward. Here is histogram of the sample duration as read from the sensor.

enter image description here

Now I also looked into the time it takes to actually "see" a new (i.e. different) sensor reading. I think this will resemble more the true E2E sampling rate. At the moment is not reflected in the actual data, there are in average 2 - 4 samples in between with the same values.

enter image description here

This is around 4 to 5 ms. Do I need to resample to 5 ms before applying filter to cater to this or can I directly configure a filter to consider this?

The cycle time of periodic movement of the system is between 2 and 8 seconds, i.e. much lower frequency than these noise problems. Can I somehow exploit this difference?

Before applying filter I had interpolated this to evenly spaced 1 ms samples to not confuse the filter algorithms.

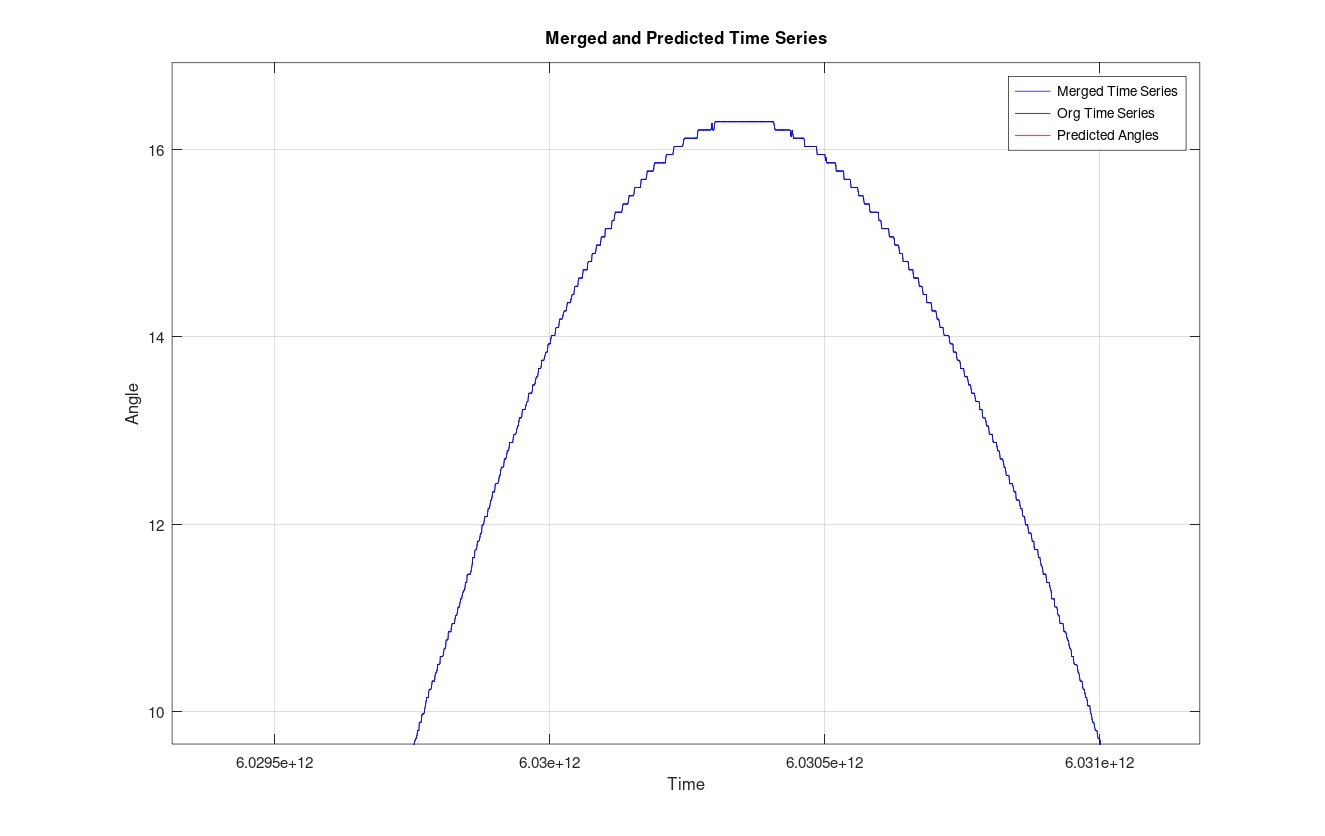
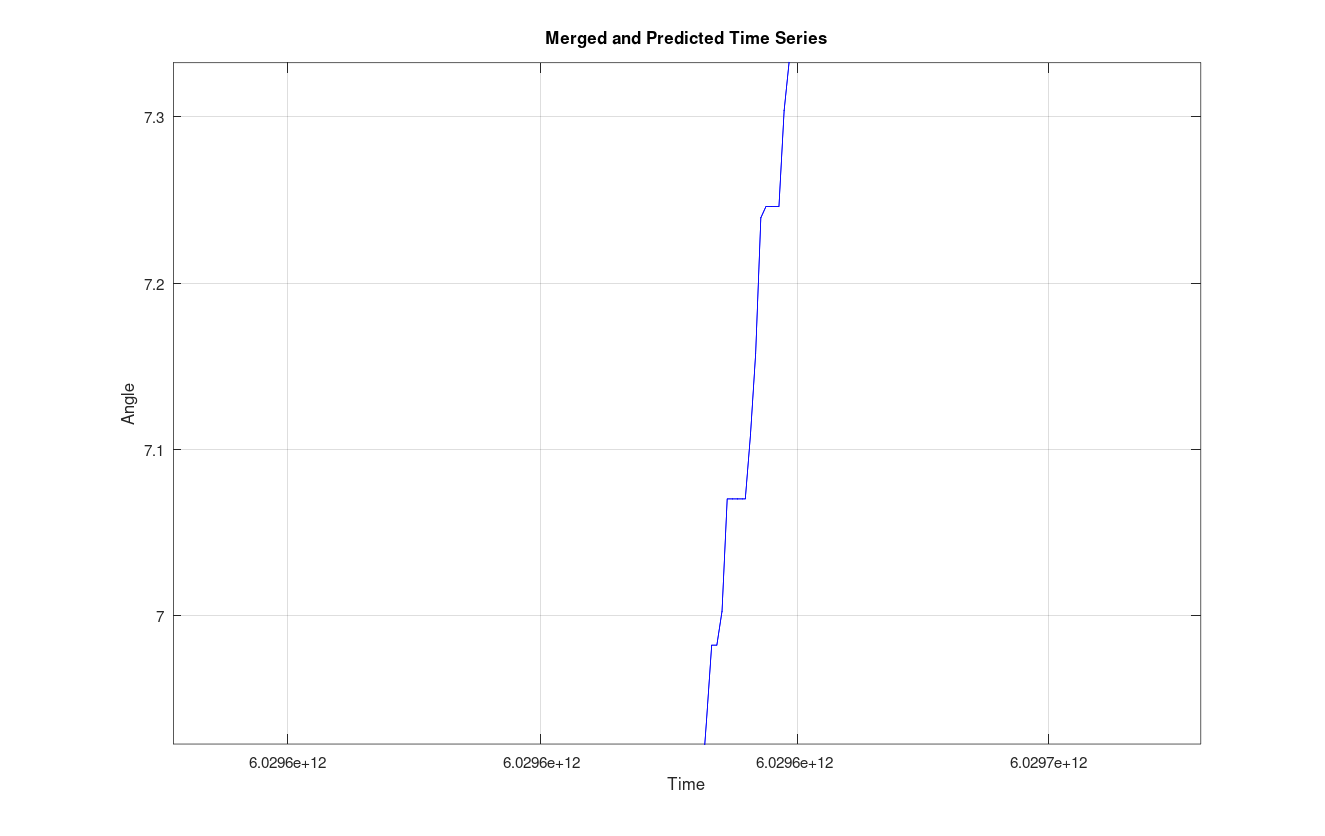
Sampling problems enter image description here

enter image description here

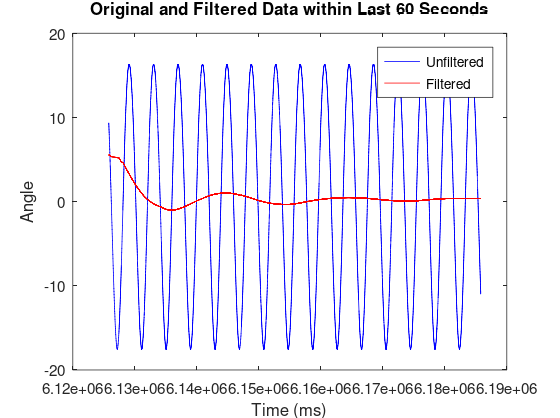
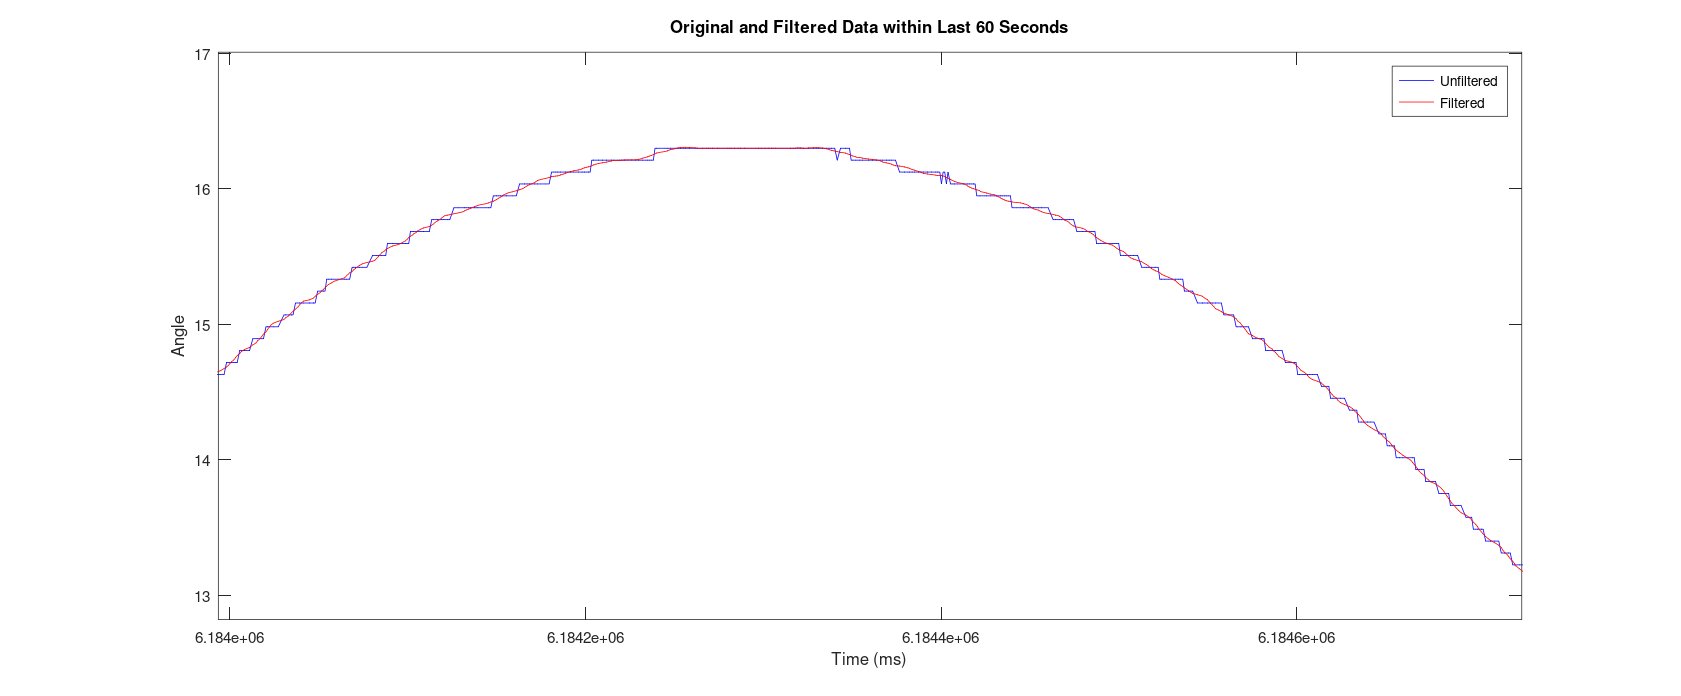
I researched a bit also worked with ChatGPT on this. Unfortunately this completely off. Here w/o resampling. But that does not change the behavior.

``

% Load time series data
data = load('data.txt');

% Extract timestamp and angle
timestamp = data(:, 1);
angle = data(:, 2);

% Find the timestamp corresponding to the last 60 seconds
last_60_sec = max(timestamp) - 60 * 1e9; % Convert 60 seconds to nanoseconds

% Extract the data within the last 60 seconds
indices_last_60_sec = timestamp >= last_60_sec;
timestamp_last_60_sec = timestamp(indices_last_60_sec);
angle_last_60_sec = angle(indices_last_60_sec);


% Define sampling artifacts range (1 - 5 ms)
artifact_start = 1e6; % 1 ms in nanoseconds
artifact_end = 5e6;   % 5 ms in nanoseconds

% Apply low-pass filter within the last 60 seconds
fs = 1e3; % Sampling frequency in milliseconds (1 sample per millisecond)
f_cutoff = 1 / 10;
[b, a] = butter(4, f_cutoff / (fs/2), 'low'); % Butterworth low-pass filter

% Filter the angle data within the last 60 seconds
filtered_angle = filtfilt(b, a, angle_last_60_sec);

% Plot both the original and filtered signals within the last 60 seconds
plot(timestamp_last_60_sec * 1e-6, angle_last_60_sec, 'b', 
timestamp_last_60_sec * 1e-6, filtered_angle, 'r');
xlabel('Time (ms)');
ylabel('Angle');
title('Original and Filtered Data within Last 60 Seconds');
legend('Unfiltered', 'Filtered');

`` enter image description here

$\endgroup$
5
  • $\begingroup$ What filters have you tried? What’s the sampling rate? $\endgroup$
    – Jdip
    Commented Mar 23 at 23:08
  • $\begingroup$ Do you get time stamps with your data so that you know real time the time for each sample, or do you need to filter out the unknown time jitter? $\endgroup$ Commented Mar 24 at 12:33
  • $\begingroup$ I take the timestamp in software while doing the sensor reading. i.e. it is not atomic with the sensor value reading in the sensor HW. This will carry some jitter, but I believe that is neglectable. My goal would basically to smoothen that out (at the expense of some accuracy) but to achieve a smoother rendering. $\endgroup$ Commented Mar 24 at 12:40
  • $\begingroup$ Can you share some of this data? $\endgroup$
    – Jdip
    Commented Mar 24 at 16:51
  • $\begingroup$ Sure, the data is in the above link in the original question. Does the access work for you? I think I found also a good solution. Will post it here now $\endgroup$ Commented Mar 24 at 17:02

1 Answer 1

1
$\begingroup$

With some more researching I looked into how a polynomial can be fitted into the data and used for filtering. Asking this questions to ChatGPT resulted in using a Savitzky–Golay_filter. While the definition in Wikipedia looks complex the usage is straight forward.

% Load time series data
data = load('data.txt');

pkg load signal

% Extract timestamp and angle
timestamp = data(:, 1);
angle = data(:, 2);

% Find the timestamp corresponding to the last 60 seconds
last_60_sec = max(timestamp) - 60 * 1e9; % Convert 60 seconds to nanoseconds

% Extract the data within the last 60 seconds
indices_last_60_sec = timestamp >= last_60_sec;
timestamp_last_60_sec = timestamp(indices_last_60_sec);
angle_last_60_sec = angle(indices_last_60_sec);

% Apply Savitzky-Golay filter within the last 60 seconds
window_size = 35; % Window size for the filtering (odd number)
degree = 3; % Polynomial degree
filtered_angle = sgolayfilt(angle_last_60_sec, degree, window_size);

% Plot both the original and filtered signals within the last 60 seconds
plot(timestamp_last_60_sec * 1e-6, angle_last_60_sec, 'b', 
timestamp_last_60_sec * 1e-6, filtered_angle, 'r');
xlabel('Time (ms)');
ylabel('Angle');
title('Original and Filtered Data within Last 60 Seconds');
legend('Unfiltered', 'Filtered');
The result looks promising. I've to try it yet in the actual rendering code. For that my next job is now to integrate Octave into C++.

From what I understood runtime is linear in degree and window size. So that should be good as well.

enter image description here

$\endgroup$
3
  • $\begingroup$ Random thought, but if you know the periodicity, instead of filtering it to smoothening it out, could you just synthesize this signal? Or am I missing something $\endgroup$
    – Jdip
    Commented Mar 24 at 18:43
  • $\begingroup$ I roughly know the periodicity. But the mechanical setup has some inaccuracies and fore sure over time also a drift. Initially I was thinking to do an FFT and then synthesize the prediction using an inverse FFT. That was my question in the other post here. There I got the suggestion to instead rather do a time-domain auto correlation and copy the signal. This was possibly easier. The signal is also not a perfect sine of just one frequency. One side of the movement is slightly different. $\endgroup$ Commented Mar 24 at 20:00
  • $\begingroup$ Unfortunately the integration to MSVC turned out to be very hard (C++ API with binaries only for g++, would need a bridge library build in plain C to achieve ABI combability) Does anybody know a free C++ implementation of the Savitzky–Golay filter? $\endgroup$ Commented Apr 5 at 20:02

Your Answer

By clicking “Post Your Answer”, you agree to our terms of service and acknowledge you have read our privacy policy.

Not the answer you're looking for? Browse other questions tagged or ask your own question.