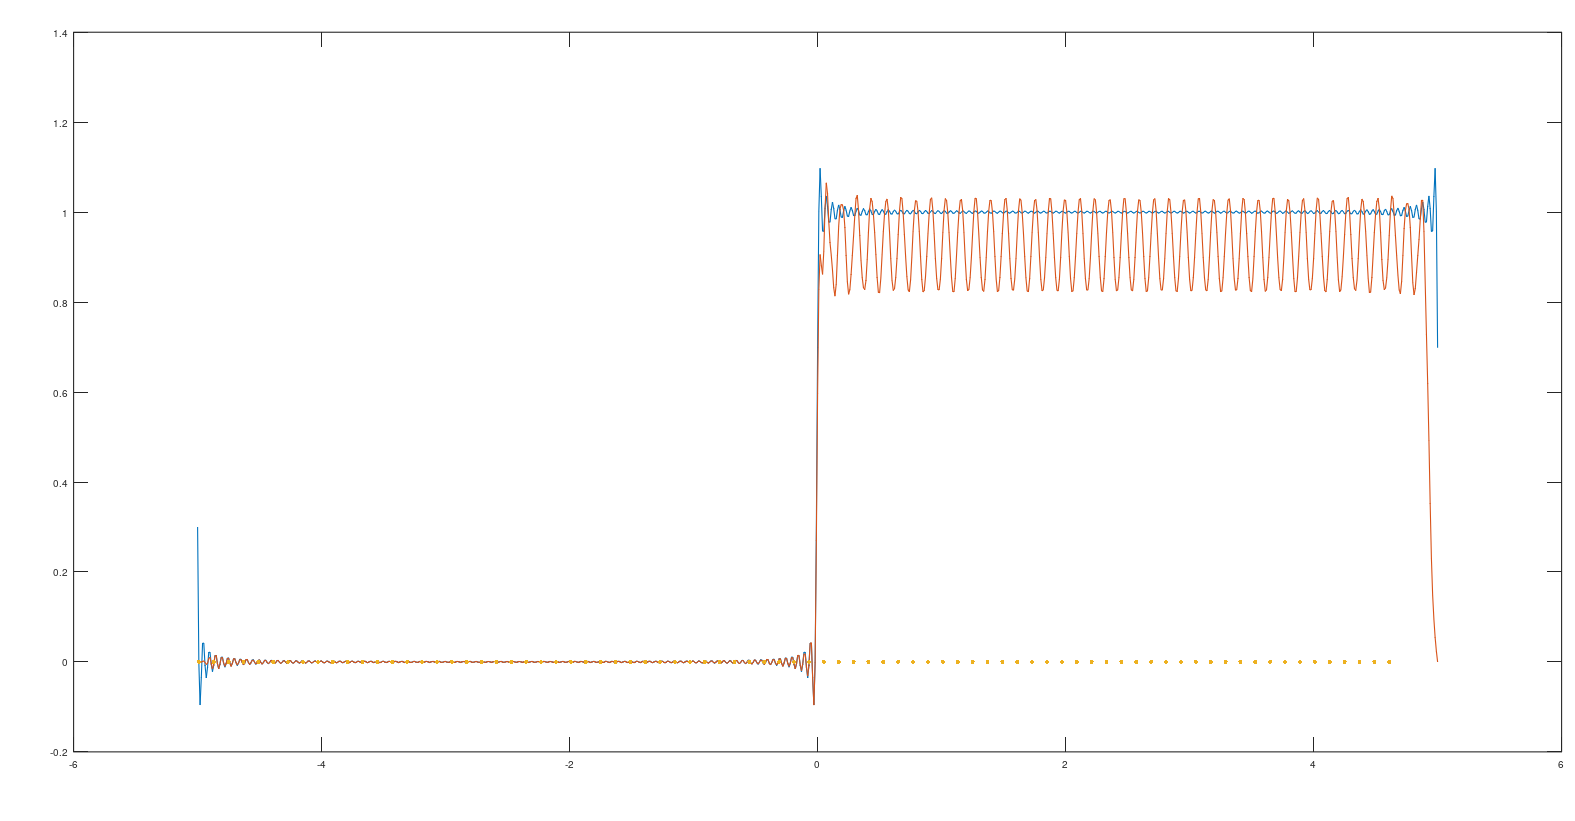
I know about using fitering(e.g. window filters that used in frequency domain), wavelets for decreasing or even full eliminating gibbs effect but don't really understand how we can use window functions in time-domain for this. Although I know that usually windows should used for decreasing spectral leakage.
For a test heavised function with gibbs effect was created. I tried using blackmanharris window with overlap about ~2/3(i read in some article that it's the best value) but it gets muuch worse with that. Playing with window size and overlap coefficient doesn't help at all. What am i missing or doing wrong?
Loaded plot picture(Blue - original heaviside jump with gibbs phenomenon, orange - windowed result):

Code:
pkg load signal

A=-5; h=0.01; B=5; p=0.6; #p - value of spectrum cut
x=A:h:B;
N=max(size(x));
y=x;
y(y>=0)=1;
y(y<0)=0;
spectr=fftshift(fft(y));
spectr(1:1+round(N/2-N/2*(1-p)))=0;
spectr(round(N/2+N/2*(1-p)):end)=0;
spectr=ifftshift(spectr);
intrp=real(ifft(spectr));
#figure; plot(x,intrp);

#init parameters
w_size=32;
overlap=0.61;

add=round(w_size*(1-overlap));
W=blackmanharris(w_size)';
Final=zeros(1,N);
b=1;
e=b+w_size-1;

  borders=[];
while (e<N)
  y=intrp(b:e).*W;
  z=Final(b:e);
  Final(b:e)=Final(b:e)+y;
  borders=[borders A+b*h];
  b=b+add;
  e=e+add;
endwhile
e=N-1;
y=intrp(b:e).*W(1:e-b+1);
Final(b:e)=Final(b:e)+y;
#main graphs
figure; plot(x,intrp);
hold on; plot(x,Final);
z=zeros(1,max(size(borders)));
hold on; plot(borders,z,".");
