I have a system and I know its impulse response $h$, this impulse response was recorded at $f_s = 48000 \texttt{Hz}$, now I can use Matlab to get the system output to an arbitrary signal ($x$) by convolving it with $h$, right?
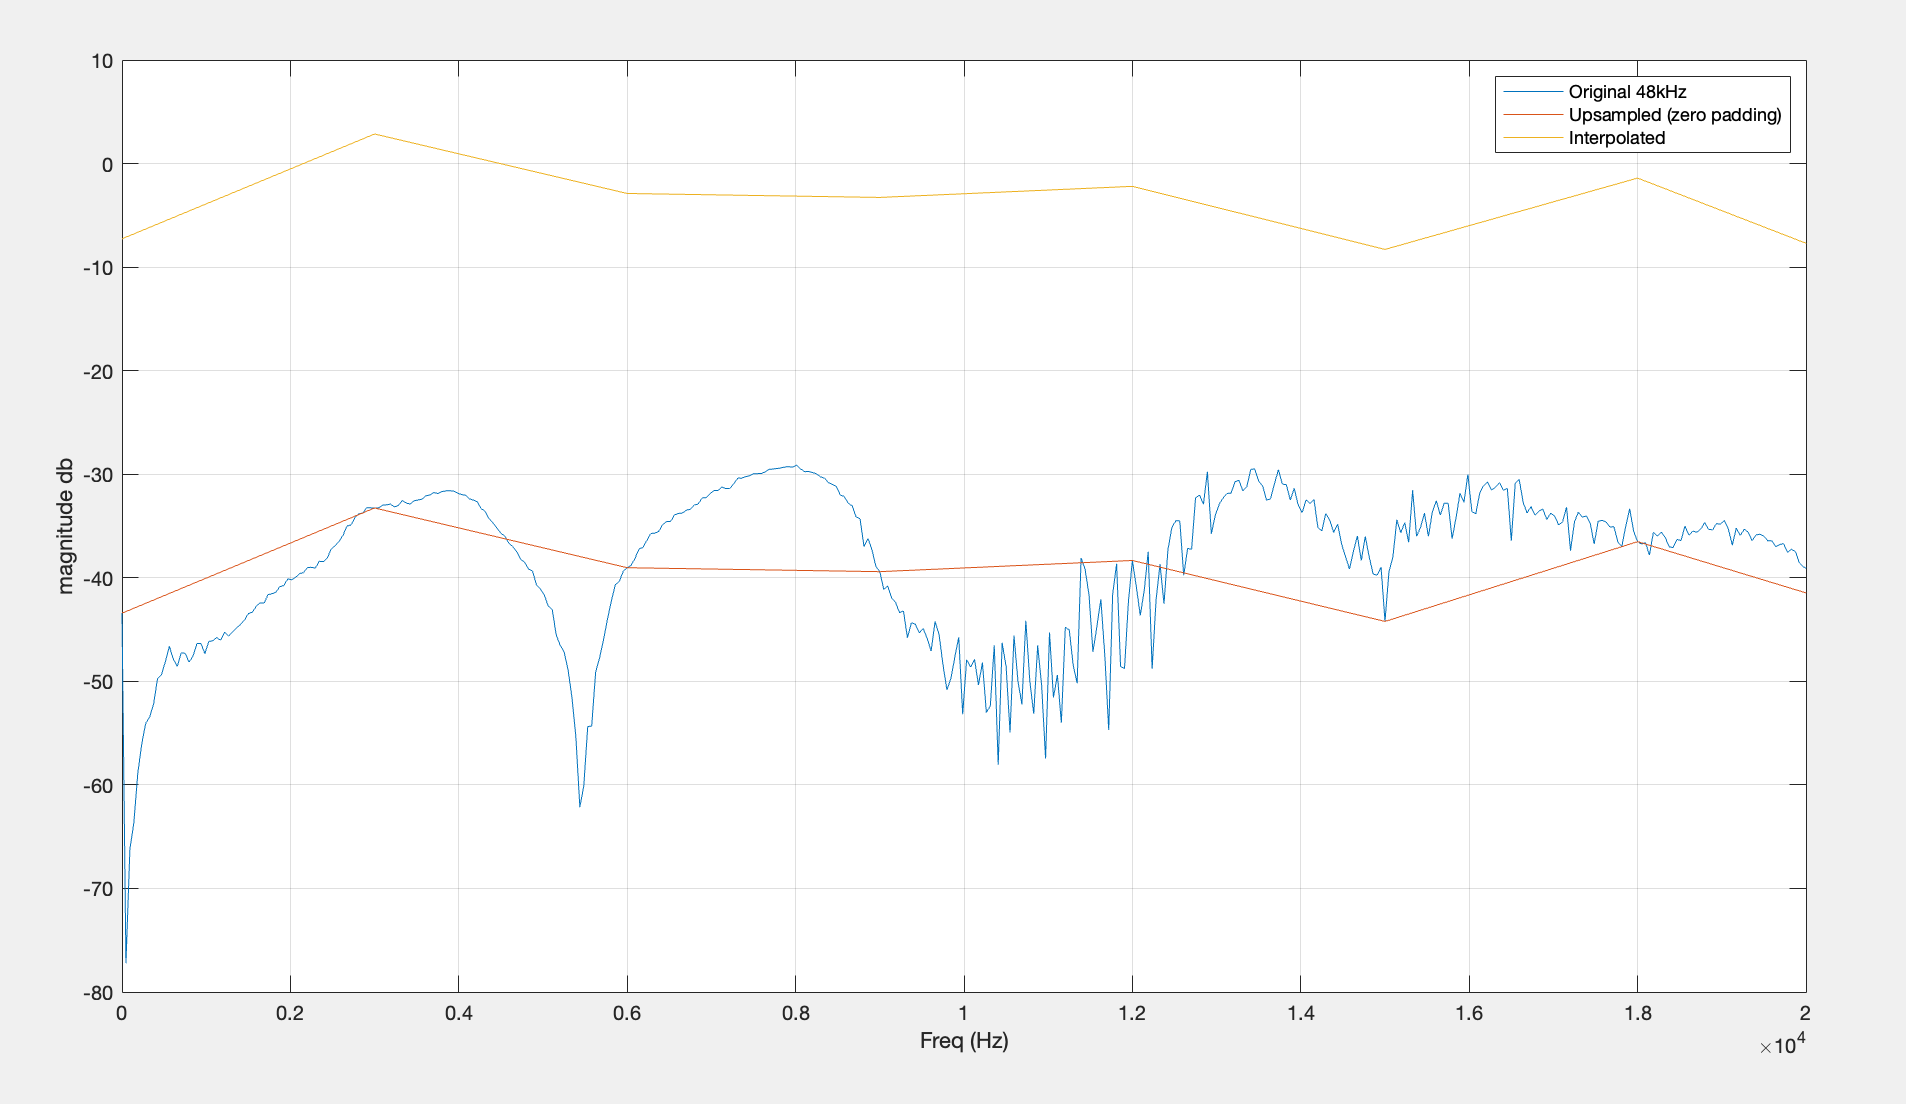
So now I want to use an input signal that its at a higher frequency [$3.072 \texttt{MHz}$ (factor $64$)] but want to use the same IR, I was hopping to just upsample the IR, either by zero padding or by interpolating the $63$ spaces between coefficients, but the output was not matching, using Matlab I got the frequency response of the Impulse response, in blue the original sampled at $48 \texttt{KHz}$, the red one is the upsampled one, yellow the interpolated.
They kind of match, but there are several gaps in the plot, is this even doable?
This is my Matlab code (top_ir is the impulse response of the system):
[h, w] = freqz(top_ir,1,[],48000);
plot(w,20*log10(abs(h)));
top_ir_3m = upsample(top_ir, 64);
[h, w] = freqz(top_ir_3m,1,[],48000*64);
plot(w,20*log10(abs(h)));
top_ir_3m = interp(top_ir, 64);
[h, w] = freqz(top_ir_3m,1,[],48000*64);
plot(w,20*log10(abs(h)));
EDIT (adding info): I understand that the original IR only contains information up to 24kHz, that is fine, we are actually going to lowpass filter everything up to 24kHz.


resample()function that you can use to interpolate between samples of your original impulse response. $\endgroup$