TL;DR
The so called (not the actual term used in bibliography though) "ghost sweeps" are absolutely normal!!!
Information
The method is termed Exponential Sine Sweep (ESS) and was pioneered by Angelo Farina. It is described very well, along with other methods, in Swen Muller's (there's those two dots above 'u' but don't know how to add them in my keyboard) paper that can be found here. Additionally, you can find more information in the original paper by Farina (here).
The method
I will describe here the main idea behind the technique. It is very similar to the Time-Domain Spectroscopy (TDS) which uses linear sine sweeps but possesses some very nice properties compared to TDS which are quite useful in many domains of acoustics and signal processing.
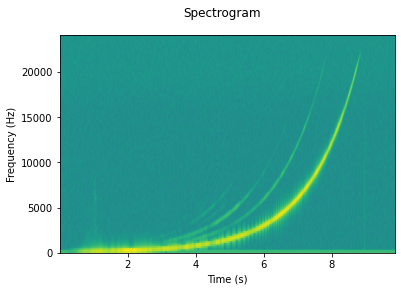
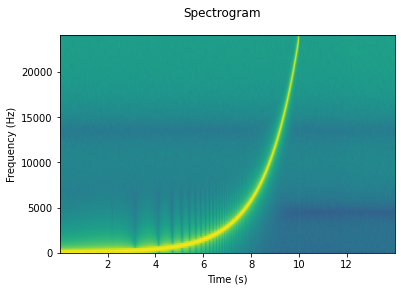
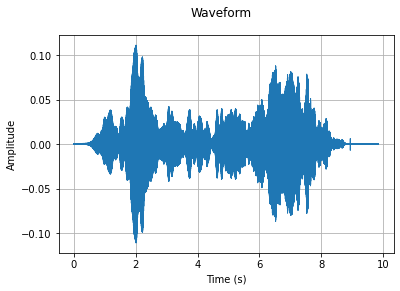
Judging from the images you posted, I assume you already know that a sweep whose frequency changes logarithmically with time is used to excite the "Device Under Test" (DUT) (this may be a room or anything that can be described/modelled as a system). The output of the device is filtered with the inverse of the input signal in order to perform deconvolution of the signal and acquire the transfer function/impulse response of the DUT.
Now, think of what would happen if you were to excite the system with a single sinewave. At the output you would get the response of the system to that specific frequency. Most probably you would see the same frequency with some altered (not necessarily though) amplitude and phase. In addition to that you would most probably see some harmonic (or other type of) distortion products. Now, if you consider the fact that at each moment in time the method excites the system with a single frequency (at least approximately) you will realise that each moment in time can be associated with a specific frequency of excitation. It should be obvious in the second image you provided.
So far so good. In the case of an "ideal" system, the output would be identical to the input (not sure this would be ideal in some sense but I'll use this term here). In your first image, which resembles a measurement, let's focus at some specific instance in time, say $6 ~ s$ which corresponds to about $3 ~ kHz$ frequency of excitation. For that specific moment in time (this is like drawing a vertical line at this $x$ position) you'll see that the "ghost sweeps" fall almost exactly (I am sure you could verify that with some magnification of the plot) at the $6 ~ kHz$ and $9 ~ kHz$ frequencies, which are integral multiples of the fundamental frequency of excitation. Thus, you can easily conclude that those are the 1st and 2nd order harmonic distortion products for that specific frequency.
As you also mention, you do perform a deconvolution in the frequency domain. The result of such a process can be seen in the following image (taken from Farina's original paper linked above).
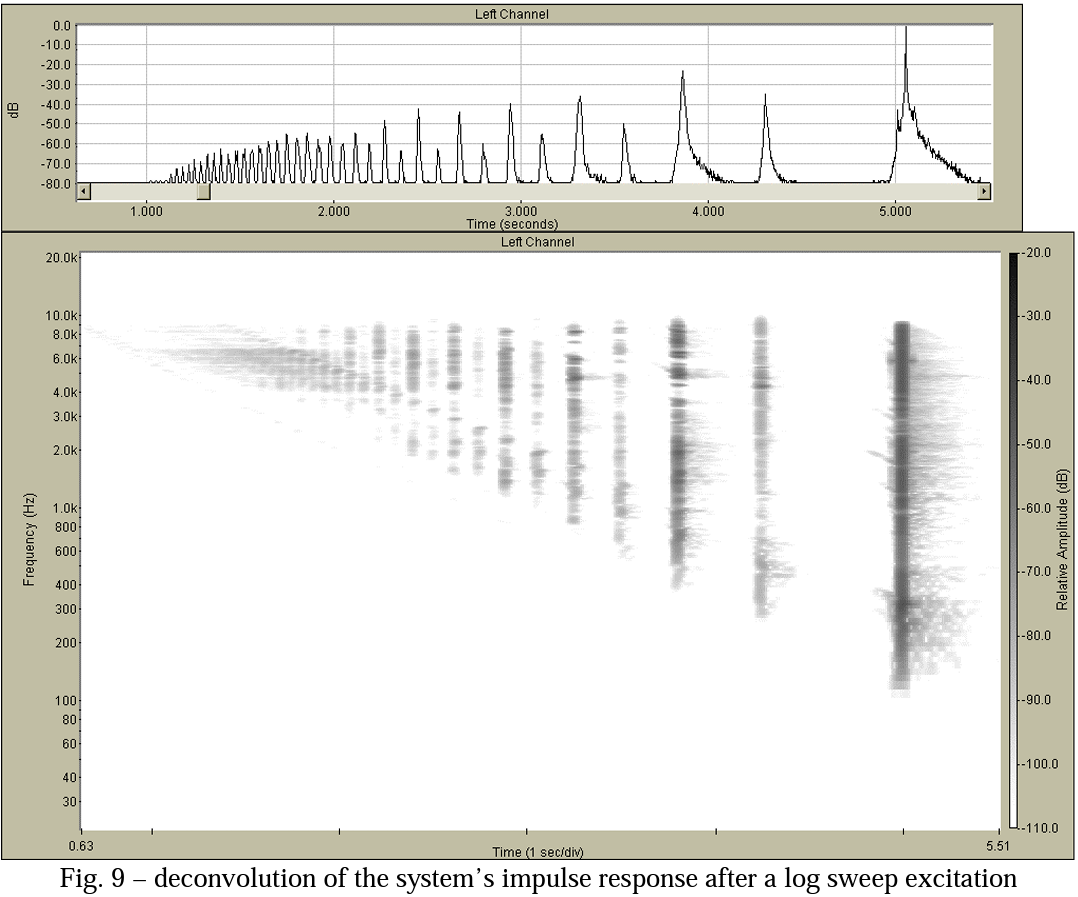
Please note here that the squared amplitude of the impulse response is shown but I hope you get the idea.
For reference, the DUT's response to a logarithmic sweep is shown in the following picture (please note that here the frequency axis is logarithmic and the sweep seems to be linear, but this is not the case) [the picture is again from Farina's original paper]
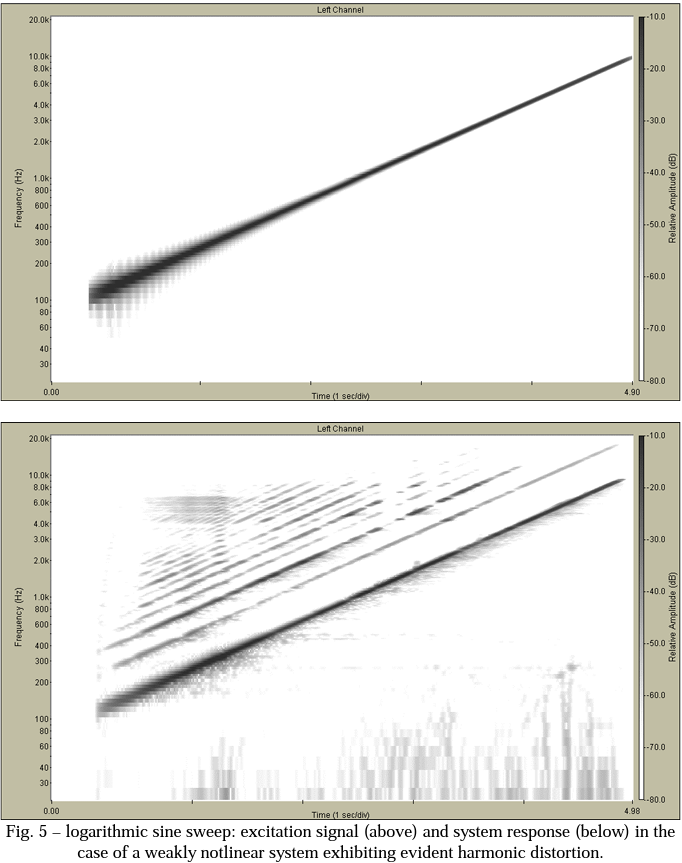
In both pictures, it is rather obvious that these are distortion products. The intuition behind that is what I described above in the "single frequency/time-instant" example.
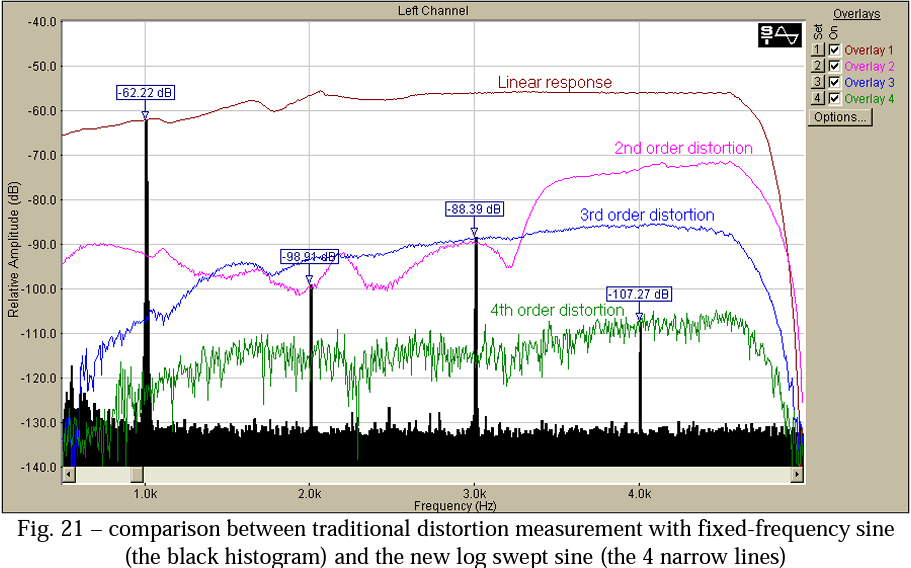
As can be seen in the first picture above, in the top graph, which depicts the time-domain representation (Inverse Fourier Transformed transfer function), one could "window out" the distortion products and acquire a data vector containing only a specific (one for each) harmonic distortion order product. Then, you can Forward Fourier Transform that vector and acquire the whole frequency spectrum of this harmonic distortion product. This is shown in the next picture (once more, from Farina's original paper) and constitutes a great feature inherent in the ESS method. In this way, one can depict the whole spectrum of the harmonic distortion products separately for each order with just a single measurement!
Deconvolution process
As you already know, the process of deconvolution can be performed in the frequency domain. As Hilmar correctly stated in their comment, there are some points here that need your attention. The main issue is the fact that the calculation of the deconvolution filter may "explode" due to numerical errors/instabilities. In case, at least one frequency bin in the sweep has a very small value, it could lead to very high values of the inverse filter which in turn will lead to erroneous, or very small values with possibly high round-off errors (or other numerical issues which I am not an expert to discuss). This is something that is very possible to happen and I can confirm it through personal experience on the matter (had to resolve the issue in the time domain in my case).
Specific case
I can't be sure as to which part of your signal chain exhibits this behavior and add so much harmonic distortion. You should troubleshoot by removing and/or replacing with some equipment that is fully characterised, one part at a time and observe the changes.
You have to keep in mind that there are many non-linear "parts" in your signal chain. Most probably, the highest harmonic distortion is introduced by the loudspeaker and maybe the microphone, as they are the "weakest" parts of the chain (they have to perform a double transduction from acoustic to mechanical and from that to electrical). You have already stated that lowering the volume alleviates the issue to some degree. This most probably is due to the fact that you effectively go into the linear operation regime of those equipment pieces.
The adapters and cables are probably the least suspicious part of the chain. The most prominent effects of those pieces are some low-pass filtering which also depends on the length of cables and quality (resistance and capacitance).
Finally, I am not sure how severe the distortion is since there is absolutely no indication of amplitude in the figures your provided.
Simple solution
As already stated above, the "ghost sweeps" are absolutely normal. One more thing to mention is that they appear before the main impulse response. The middle point of the deconvolved data vector should represent the "zero-time" of the vector (this depends on your processing though and should be treated with caution). On the left of it (anti-causal part) will lie the harmonic distortion impulse responses and on the right of it (causal part) will lie the DUT's impulse response, most probably with some initial delay to the first peak representing the propagation delay (depending on what the DUT is, you may see various values for this). If you would like to get only the DUT's impulse response you could just "window out" the causal part of the result and use that.
There are various issues that come with ESS which may, or may not, be obvious at first sight. Farina has published another paper discussing those issues (such as the fact that it is more appropriate to use longer sweeps than averaging many of them and the "pre-ringing effect"). You can find the paper here.



1/fft(sweep)for excessive inversion gain at very high and low frequencies. c) post your original sweep as well $\endgroup$1/fft(sweep)actually does) 'cause I have done it in the past and had some hard time spotting the error (very high values in the inverted signal). As for the "ghost sweeps", I believe they are supposed to be "normal" when harmonic distortion is present. This is one of the reasons this method is used (get the harmonic distortion in orders inherently in the measurement) and people usually (cont.) $\endgroup$