2
$\begingroup$

I'm currently working on a project where I have to measure the latency of a given system. Below you can see a exemplary image which shows the input pulse (green) and the response (blue).

Oscilloscope screenshot with input pulse (green) and response (blue)

In order to compute the latency I have to detect when the blue curve starts to rise. I'm wondering what approach would be the most suited. My first thought was to check the derivative of the signal, however as the actual sampled signals tend to be quite noisy, I guess some sort of anti-noise filter will be necessary.

I wonder if there is a fancy way of solving this problem.

Another topic I looked into is edge and step detection. However, I'm not sure if this specific problem really applies as the signal in question gradually increases instead of jumping.

In short: I'm looking for a efficient way of finding the start point

Side Info: As I'm working on a Microcontroller, the proposed method should ideally be memory efficient (and fast).

$\endgroup$
3
  • 1
    $\begingroup$ Do you want a robust approach to characterizing the systems delay and for that can you use any arbitrary input signal? Or do you want the best you can do limited to using a step at the input? $\endgroup$ Commented Feb 1, 2023 at 15:34
  • $\begingroup$ can you describe what time you actually want to determine, maybe as small annotation in the picture? Is it time from rising edge of green to begin of blue slope, or from falling edge? What's an acceptable time you can take from signal to determination of the time difference? Is this a one-shot measurement, or are both green and blue signal periodic? What microcontroller, and what sampling rates, are we talking about? What is known about the blue signal? does it always have the same (noisy) shape, or can the slopes and the plateau have different lengths and amplitudes? $\endgroup$ Commented Feb 1, 2023 at 15:57
  • $\begingroup$ @DanBoschen In this case the input signal would always be a step. The application is measuring the latency of a camera system with the input signal being a flashing LED and the response being the displayed image (Due to the line-by-line image construction on the display the response gradually rises). I hope that answers your question. $\endgroup$
    – luisuark
    Commented Feb 3, 2023 at 8:06

3 Answers 3

2
$\begingroup$

Here's an approach I've used. It's used to enhance the upslope and suppress the remainder of the waveform, and can be efficiently implemented:

  1. Low-pass filter your data (as you've mentioned, the derivative enhances high frequency content).

  2. Compute the Slope Sum Function (SSF): $$\texttt{SSF}(i) = \sum_{k=i-w}^{i}\Delta_{u_k}, \quad \Delta_{u_k} = \begin{cases} \Delta_{y_k} & \Delta_{y_k} > 0 \\ 0 & \Delta_{y_k} \leq 0 \end{cases} $$

    • $w$ is the length of the analysis window (experiment and see which works better for you, a smaller value will be faster-acting).
    • $\Delta_{y_k} = y(k) - y(k-1)$ is the derivative of the low-pass filtered signal of interest.
  3. Define an appropriate threshold above which you’ll find the onset. This threshold can be empirically designed, or can be based on the $\texttt{SSF}$ values ($\texttt{SSF}_{max}/\texttt{someValue}$ or $\texttt{SSF}_{avg}/\texttt{someValue}$ for example)

$\endgroup$
2
$\begingroup$

I believe it would be the midpoint of the resulting ramp that would be the best estimate of the actual delay, not the first instant of the output rising. That said, if we want to minimize processing, no derivative is required (which enhances noise, leading to additional filtering, false detection, etc). From the plot given there is significant noise immunity between the midpoint of the output and the floor, so detecting midpoint after simpler filtering would require minimum processing and be robust. Simply start a counter when the known pulse starts, and have a threshold detector at mid-amplitude for which to stop the pulse. Filter the signal prior to detection as needed with a simple moving average filter of $N$ samples, and subtract the known constant group delay of the filter from the result. The group delay of a moving average filter is flat based on one less than half the total number of samples in the average. The trade of filtering is reducing the noise in the result at the expense of additional latency to get the answer needed.

To demonstrate the mid-point theory, I made a pulse that is itself followed by a 5 sample moving average (to create the resulting ramps with a known delay, in contrast to using it for filtering as described above...but this also shows that the system in question is effectively going through a moving average process itself).

Experiment:
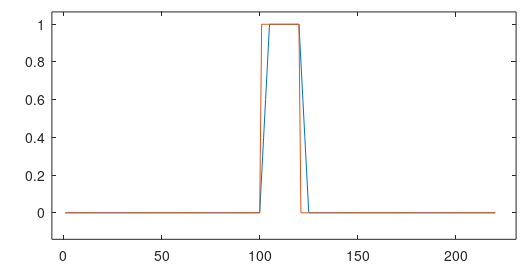
experiment

It is well known that the delay between input and output of a moving average over $N$ samples is $(N-1)/2$ samples as a linear phase filter with flat delay over all frequencies. Note how the output in this simple test starts rising immediately, but we know the delay is not zero! However if we zoom in on the edge, we see that the midpoint is indeed at 2.5 samples, consistent with the actual known delay:
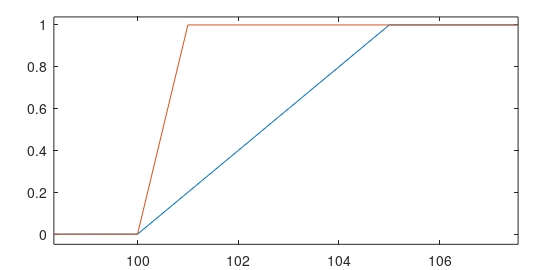
zoom in

So in summary for a robust and simple approach, set a detection threshold at mid-level. Start a timer (at precision desired) when the initial pulse starts. Filter the signal with a simple moving average filter over $N$ samples (as an aside, a CIC filter is a moving average filter and this filtering could be part of a decimation process if the sampling rate could also be lowered, maximizing efficiency!). Choose $N$ so that the standard deviation of the resulting amplitude noise is less than that desired for detection error, using the expected slope of the output of the signal after filtering to convert magnitude error to time error. Stop the timer when the filtered signal crosses the threshold. Subtract the known $(N-1)/2$ sample delay from the delay determined with the timer. Restart process on next pulse.

$\endgroup$
0
$\begingroup$

My initial thought will be to use a simple low-pass filter, e.g. moving average, to get rid of the noise (as your values seem to oscillate around an underlying trend). You can then use the derivative (still with caution - as derivative operation amplifies any underlying signal noise) to find the point at which it increases from zero.

$\endgroup$

Your Answer

By clicking “Post Your Answer”, you agree to our terms of service and acknowledge you have read our privacy policy.

Not the answer you're looking for? Browse other questions tagged or ask your own question.