0
$\begingroup$

Assume that we got a sine wave function

$$u(t) = A\sin(2\pi \omega(t)t)$$

Where the frequency $\omega(t)$ changes over time $t$ and $A$ is the amplitude.

Assume that we apply that $u(t)$ signal onto a transfer function $G(s)$ and we receive the output $y(t)$ in the time domain.

Then our goal is to create the bode plot diagram of $u(t)$ and $y(t)$.

I begin to do the FFT analysis.

$$F_u(t) = \mathcal{F.T}\bigl\{u(t)\bigr\}$$ $$F_y(t) = \mathcal{F.T}\bigl\{y(t)\bigr\}$$

Then I compute the ratio

$$H(t) = \frac{F_y(t)}{F_u(t)}$$

And then I cut everything in half

H = H(1:end/2)
w = w(1:end/2)

And then I plot the diagram where the y-axis is $20\log_{10}(| H |)$ and x-axis is w

Problem:

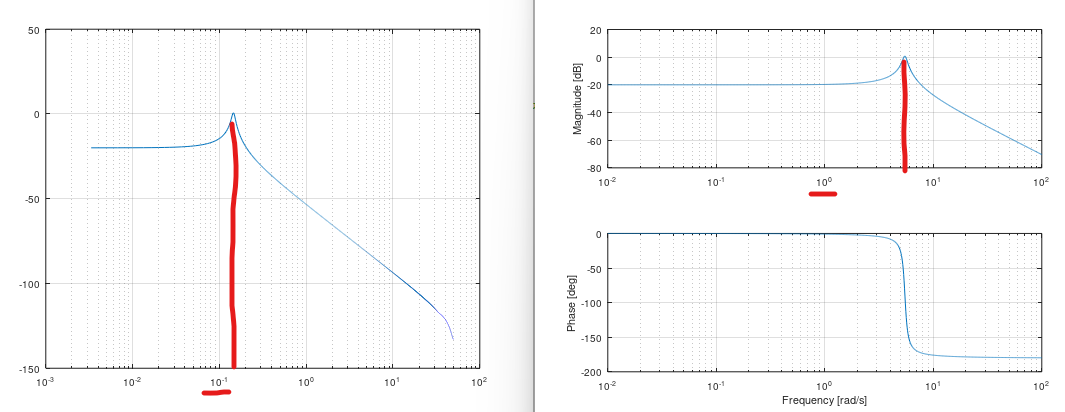
The problem is that the frequencies are not correct. To "shift" them to the correct values , I need to multiply with a constant a:

w = w*a

Question:

How do I find that constant a?

How to reproduce the issue:

close all
% Input and model
N = 30000;
t = linspace(0.0, 50, N);
w = linspace(0, 100, N);
u = 10*sin(2*pi*w.*t);
G = tf([3], [1 0.5 30]);

% Do frequency response
y = lsim(G, u, t);
close all

% Do FFT
fy = fft(y);
fu = fft(u);
H = fy./fu;

% Windowing - Half
H = H(1:end/2);
a = 1;
w = w(1:end/2)*a;

semilogx(w, 20*log10(abs(H))); 

% Do bode without phase
bode(G);

enter image description here

Goal:

My goal/aim is to find the transfer function from measurement data. Estimation/identification.

$\endgroup$

2 Answers 2

1
$\begingroup$

There are a couple of issues here.

  1. Have a look at how to properly generate a linear chirp (https://en.wikipedia.org/wiki/Chirp)
  2. Make sure to choose a frequency range consistent with your sampling frequency (i.e. from $0$ to $f_S/2$)
  3. Generate the frequency axis for the plot taking into account the FFT size and the sampling frequency (also note that bode uses the angular frequency in rad/s for the x-axis, so you need to multiply the frequency in Hertz by $2\pi$)
close all
% Input and model
N = 30000;
t = linspace(0.0, 50, N).';
T = t(end)-t(1); % chirp duration

fs = 1/(T/N);  % sampling frequency
f0 = 0;        % start frequency
f1 = fs/2;     % final frequency
c = (f1-f0)/T; % chirp rate

u = 10*sin(2*pi*(c/2*t.^2 + f0*t));

G = tf([3], [1 0.5 30]);

% Do frequency response
y = lsim(G, u, t);

Nfft = 32768; % taking the next power of 2

% Do FFT
fy = fft(y,Nfft);
fu = fft(u,Nfft);
H = fy./fu;

% (Angular) frequency axis for the plots
omega = [0:Nfft-1]/Nfft*2*pi*fs;

% Windowing - Half
H = H(1:end/2);
omega = omega(1:end/2);

% Do bode without phase
bode(G);

% Overlay the curves on the same plots
subplot(211); 
hold on;
semilogx(omega, 20*log10(abs(H)),'r--'); 
subplot(212); 
hold on;
semilogx(omega, (angle(H)/pi*180),'r--'); 
$\endgroup$
4
  • $\begingroup$ Thank you. Very good MATLAB/Octave code. By have you chosen Nfft = 2^15 = 32768 ? :) $\endgroup$
    – euraad
    Commented Oct 29, 2022 at 11:02
  • 1
    $\begingroup$ That is not necessary, but FFT is usually more efficient for powers of 2. $\endgroup$
    – Vito
    Commented Oct 29, 2022 at 11:08
  • $\begingroup$ Ok. Why does it not matter what type of amplitude I include at $u$ signal? $\endgroup$
    – euraad
    Commented Oct 29, 2022 at 12:15
  • 1
    $\begingroup$ Yes....right...it's the ratio of the amplitude that matters... $\endgroup$
    – euraad
    Commented Oct 29, 2022 at 12:29
1
$\begingroup$

Note this part of your code:

t = linspace(0.0, 50, N);
w = linspace(0, 100, N);
u = 10*sin(2*pi*w.*t);

The instantaneous frequency at time index $n$ is given by the phase difference between points $n-1$ and $n$.

In your case, the phase difference is $2\pi \Delta (wt)$, and this is something like $2\pi(w\Delta t + t\Delta w + \Delta t \Delta w)$, which is not what you want. You want something like $w \Delta t$.

In order to make proper frequency modulation, you have to integrate instantaneous frequency in order to get the proper phase at each time index.

Something like (in Octave code):

# accumulator
bac = 1; aac = [1 -1];
phases = filter(bac, aac, w);
x = sin( phases );

where the vector $w$ contains the instantaneous frequency (in radians per sample).

The above needs correction for units. Your code does not properly show sampling frequency, so you must transform radians and samples to your time and frequency units.

$\endgroup$

Your Answer

By clicking “Post Your Answer”, you agree to our terms of service and acknowledge you have read our privacy policy.

Not the answer you're looking for? Browse other questions tagged or ask your own question.