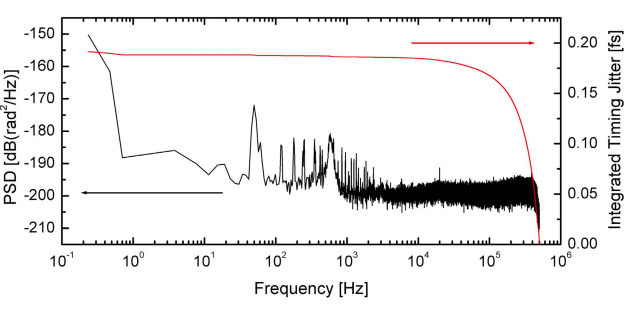
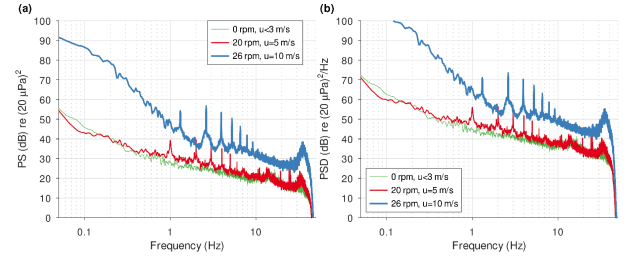
In these power spectral density plots shown above (taken from the web 1,[2]), the spectra show a roll-off at the highest frequencies, as shown in the figure. For my own example, when I calculate PSD from time domain data taken with a sampling rate of 10 MSa/s using Welche's method, this roll-off appears at half the sampling rate in the spectra, which is after 5 MHz. Is this an artifact of the FFT or Welche's method, or could you please explain the reason behind this roll-off?
I have attached two figures where I see this roll-off. Thank you for your time.


