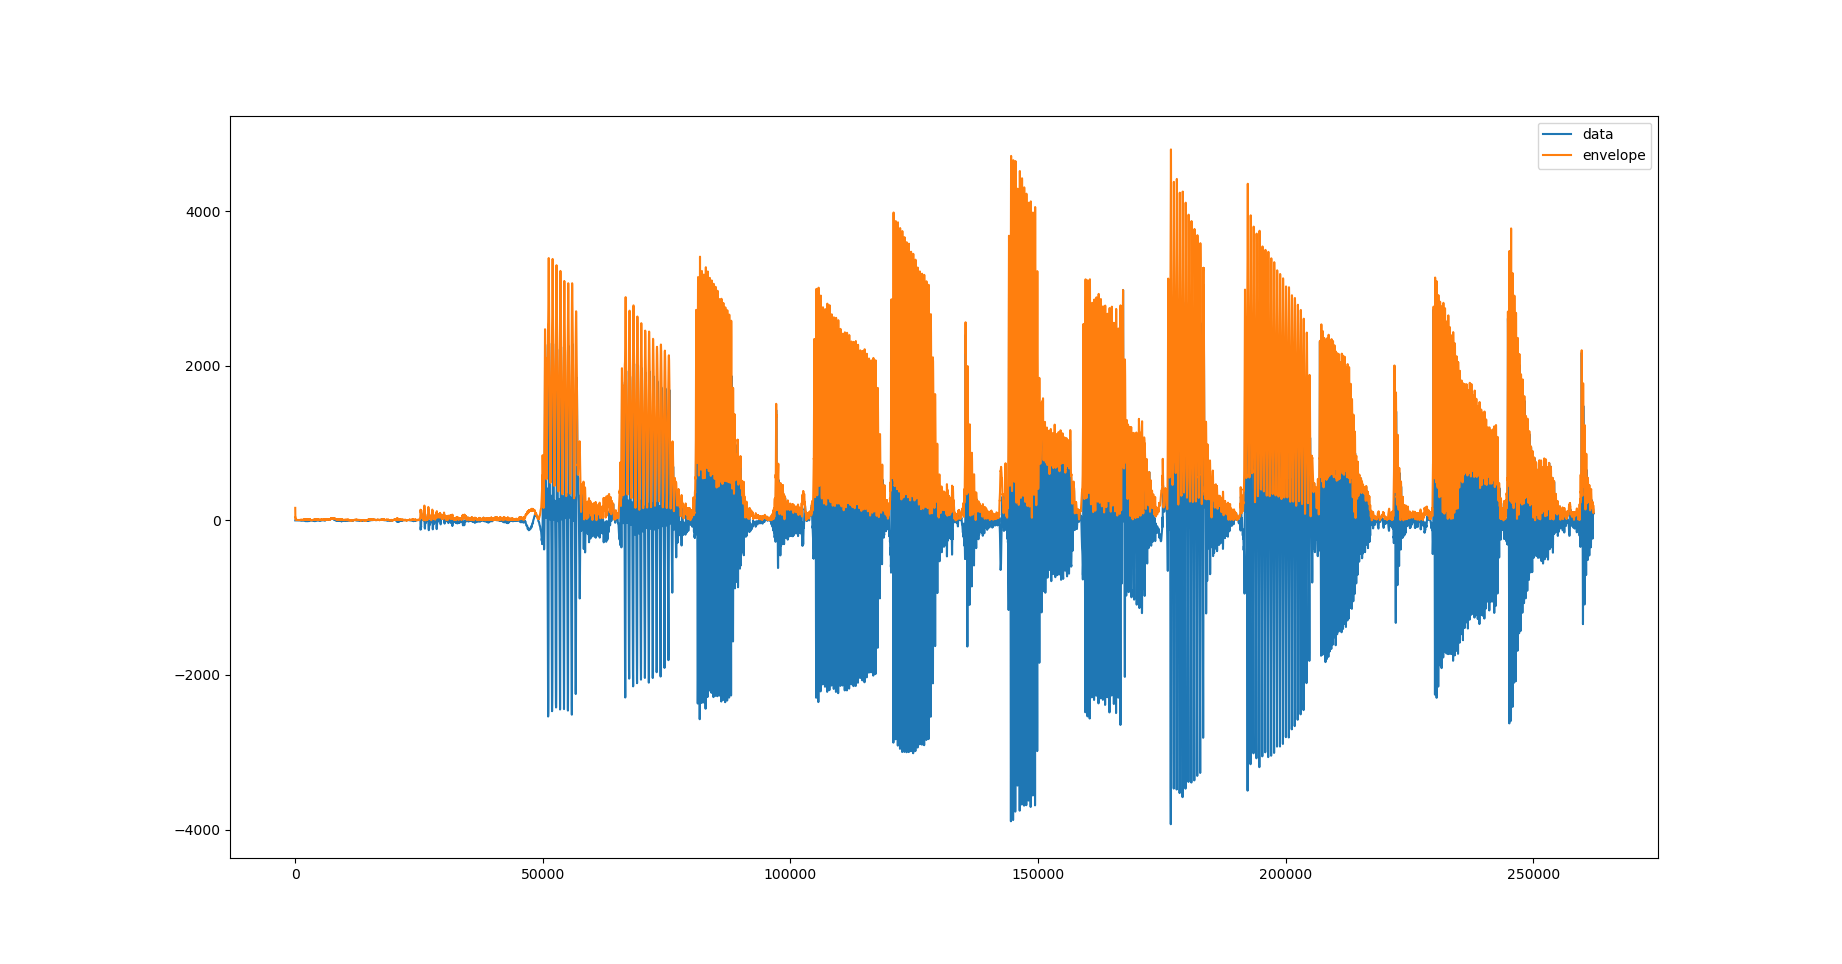
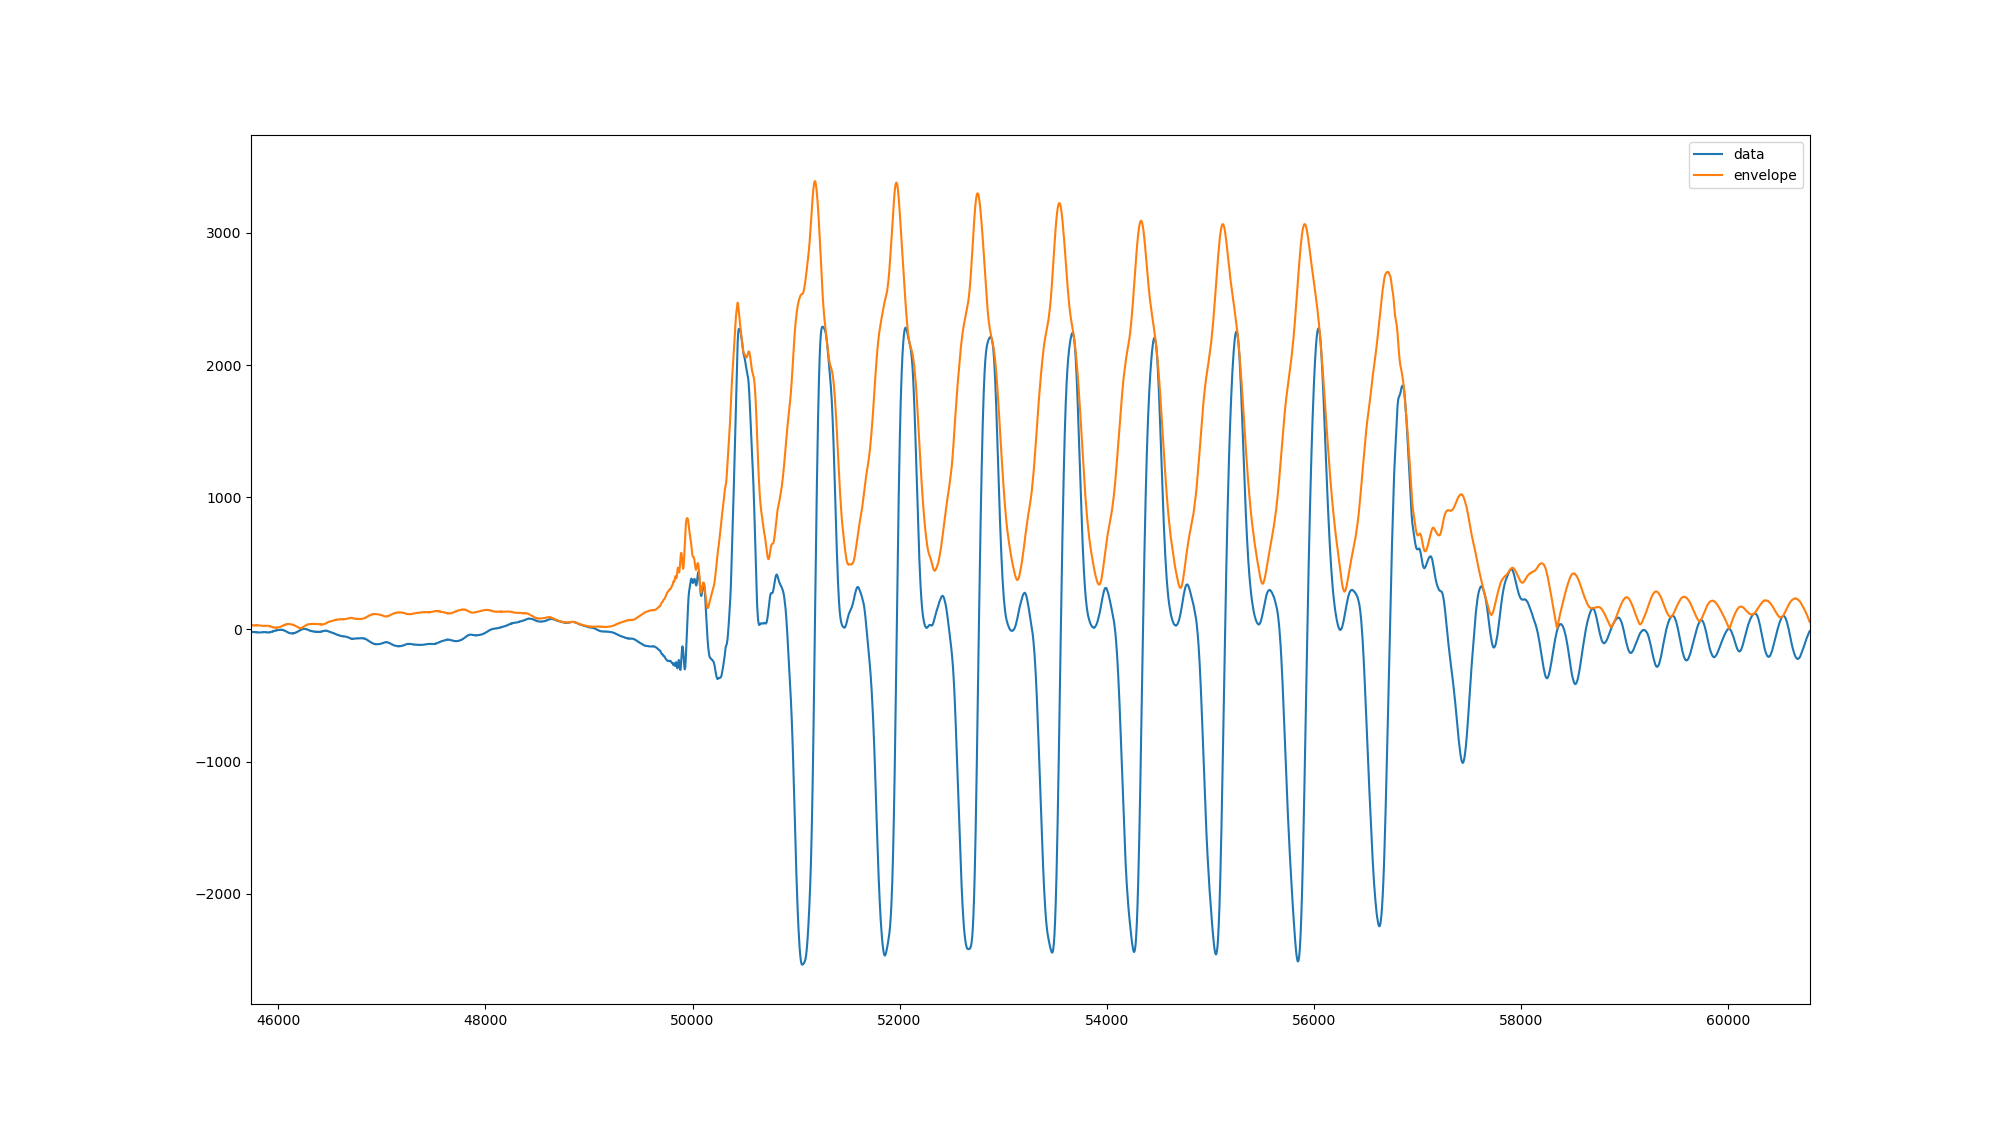
I'm trying to obtain the envelope of an audio signal by using the Hilbert method. My code generates the analytical signal in the same way as scipy.signal Hilbert() function does (I basically copied the scipy source code in troubleshooting this issue). As can be seen from the pictures below the envelope is not obtained and it seems there is a lot of periodic signal left after the envelope extraction.
I've not used the Hilbert method before so maybe this is an inherent limitation of the method? Yet all the pictures I've found on the internet show a really neat envelope extraction, why wouldn't it work in this case?
I've tried scipy's hilbert function and it gives identical results.
The code used to generate these images:
'''
import numpy as np
import matplotlib.pyplot as plt
import wave
#functions to read wav files

def read(filename):
    global raw_bin
    global res
    global channels

    file=wave.open(filename,mode="rb")
    samplerate=file.getframerate()
    length=file.getnframes()
    channels=file.getnchannels()
    res=file.getsampwidth()
    bits=res*8
    raw_bin=file.readframes(length)

    data=list(map(forward_conv,range(length//channels)))

    return samplerate,bits,data

def forward_conv(i):
    global raw_bin
    global res
    global channels

    i=i*res*channels
    current=int.from_bytes(raw_bin[i:i+res],"little")

    if current >= (2**(res*8)//2):
        current -= 2**(res*8)

    return current


filename = 'bas.wav'

#read wav file
samplerate, bits, data = read(filename)

#ensure length of data is a power of 2
bits = int(np.log2(len(data)))
data = data[:2**bits]

#remove DC bias
mean = np.mean(data)
data = [x - mean for x in data]

def Analytical_signal(data):
    fft = np.fft.fft(data)

    N = len(data)

    for i in range(1, N//2):
        fft[i] *= 2

    for i in range(N//2 + 1, N):
        fft[i] *= 0

    return np.fft.ifft(fft)


analyticData = Analytical_signal(data)

plt.plot(data, label='data')
plt.plot(np.abs(analyticData), label='envelope')

plt.legend()
'''


