6
$\begingroup$

I am trying to find the one-dimensional velocity of a car based on position measurements, similar to the Wikipedia article. The car moves at almost constant speed and I am mostly interested in getting smooth velocity estimates.

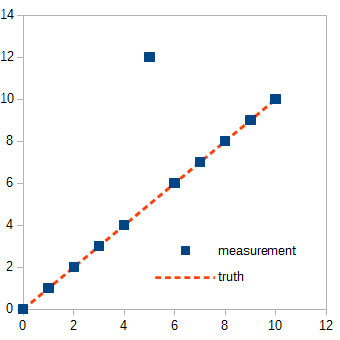
My problem is that while the sensor usually gives good values, sometimes there are strong outliers where the position makes huge jumps from close to the true value and back. Or the measured position stays constant (even though the car is moving at constant speed) and after say 5 values the measured position jumps back near the true value.

As I am new to velocity estimation and Kalman filters, I have made a first implementation according to $$\hat{\dot{x}}_{k} = \hat{\dot{x}}_{k-1} (1 - \alpha) + \alpha \frac{z_k - z_{k-1}}{\Delta t}$$ hoping to understand the problem better. $\hat{\dot{x}}$ is the estimate of the velocity and $z$ is the measured position. This already gives decent results except that the effect of the outliers is too strong. I was therefore thinking about trying to remove outliers from the input, e.g. by selecting the median of a sequence of positions.


Question: Do you think this is a useful approach? How should I try to get rid of unrealistic values?


Update: I tried a standard Kalman filter with state vector $(x, y, \dot{x}, \dot{y})^T$. I set the covariance matrix of the process noise $\mathbf{Q}$ to be due to random uncorrelated accelerations in $x$ and $y$ of equal magnitude and the covariance matrix of the measurement noise $\mathbf{R}$ to be diagonal. I tested different values of the parameters and found the results to be quite impressive. The state vector without accelerations $\ddot{x}$ and $\ddot{y}$ even worked better than with accelerations. So it seems that I do not even need an additional median filter. Unfortunately, I cannot share any measurements.


Addendum: Thanks for the help. So if I understand correctly, each correction step is only done when, for a state vector of $(x, \dot{x})^T$, $ \vert x_{k, pred} - z_k \vert < \sqrt{{p_{1 1}}_{k, pred}} \frac{2}{3}$ is true?

The original problem may look like this (position over time):

Single outlier

What if the data set looks like the following? Is there a way to deal with this behavior?

enter image description here

$\endgroup$
3
  • $\begingroup$ Welcome to SE.SP! Interesting question. I'd try implementing the standard Kalman filter first, and see the effects on the velocity estimate then. Median filtering can certainly improve things, but I'd try the vanilla approach first. $\endgroup$
    – Peter K.
    Commented Feb 10, 2022 at 22:00
  • $\begingroup$ Can you share a set of measurements? $\endgroup$
    – Royi
    Commented Feb 11, 2022 at 22:48
  • $\begingroup$ Good to hear. Thanks for the update. $\endgroup$
    – Peter K.
    Commented Feb 15, 2022 at 23:02

3 Answers 3

3
$\begingroup$

One classic way to deal with outliers is taking advantage of the statistics behind Kalman Filter.

The state vector is basically the mean value of a Multivariate Gaussian Distribution.
The covariance is the covariance of this distribution.

Once you have a measurement, you can compare it to the prediction of the model. If they are more than $ 2 \sigma $ / $ 3 \sigma $ apart you may consider it as an outlier measurement.

One way to deal with outliers is just skip them and wait for a new measurement which fits the model. Skipping means we iterate the prediction step while not applying any correction step.

$\endgroup$
4
  • $\begingroup$ And note that for a full Kalman filter, you skip a measurement by just doing the prediction step (update $\mathbf P$ and $\dot {\mathbf x}$ but don't apply correction). For your given lowpass filter you'd set $\alpha = 0$. $\endgroup$
    – TimWescott
    Commented Feb 15, 2022 at 15:26
  • $\begingroup$ @Royi, could you please tell me where the 2/3 Sigma comes from? Is it the 50% probability? I am familiar with the 68–95–99.7 rule and this is the first time I hear about this 2/3 sigma. $\endgroup$
    – Rokai
    Commented Apr 5, 2023 at 22:02
  • $\begingroup$ @Rokai, I didn't mean 2/3 Sigma as $ \frac{2}{3} \sigma $ but as 2 or 3 Sigma. Anyhow, I made it clearer. $\endgroup$
    – Royi
    Commented Apr 6, 2023 at 5:30
  • $\begingroup$ @Royi thanks. It seems that the OP understood $\frac{2}{3}$ too. $\endgroup$
    – Rokai
    Commented Apr 7, 2023 at 14:15
3
$\begingroup$

It looks like you have two distinctly different kinds of outliers, and I think you need two different rules to detect them.

One is the regular old statistical outlier; that one you can treat as @Royi suggests, by looking for a measurement that has more than a certain discrepancy from the predicted value.

The other one looks like you have a repeated measurement. In that case, if the measurement is repeated exactly, then you can have a decision process that says something along the lines of "if I get a measurement that is bit for bit exactly the same as the last one, then reject it".

If you ever expect such measurements (e.g., if that's what happens when the car isn't moving) then you might combine that bit-for-bit exact match with some reduced threshold of the expected value to throw it out.

For either sort of outlier, just throwing the measurement works, but it leaves your filter in a position where it can get stuck. If, by some chance, the filter gets off track, then it can start calling valid measurements outliers. If you don't let those measurements affect your state at all, then you'll stay stuck, forever.

There's a bunch of different ways of dealing with this. The three simplest ways that I know are:

  1. Count the number of outliers in a row, and if it exceeds some threshold, reset your filter, or if there's an executive smart enough to handle it, throw a fault, or both.
  2. When you get an outlier, run your Kalman with a significantly increased measurement covariance. This will have the effect of slowly walking the filter in the right direction if it's the filter that's wrong and not the measurement. You can either use some fixed value of the measurement covariance for this, or you can increase the covariance proportional to the distance^2. The former runs the risk of still responding too much to really big outliers, the latter will make your filter act sorta-kinda like a gradient descent filter for that one sample.
  3. Maintain multiple versions of the filter*. You probably want to just have two, for your own sanity. One always throws out outliers, the other always keeps them. Normally you'd consider the one that throws out outliers as being the 'good' filter -- but if you ever see the one that always keeps outliers get distinctly better, clone it into the 'good' filter and carry on (again, possibly after throwing a fault).

* This is a poor-man's particle filter. You could find ways to fork the filter on every outlier, and try to maintain track on every possible hypothesis of "is this outlier-looking thing any good? But madness lies on that path.

$\endgroup$
1
$\begingroup$

If your sensor has known measurement error (e.g. you can interpret your measurement as ground truth value + normally distributed noise described by measurement error standard deviation), then I would suggest instead of measuring distance between sensor value and predicted value -> find out the degree of overlapping of the two gaussian distributions- the one which was predicted by the Kalman filter and what the current sensor measurement resembles. The value reported by the sensor will be the "mean" of the sensor value distribution. They way of finding the overlapping area was discussed in details here: Calculate probability (area) under the overlapping area of two normal distributions.

You will need to define a threshold based on the area of intersection of the predicted and measured distribution of the value. If intersection area is smaller than designated threshold - reject the measurement.

example of overlapping calculation

The example image demonstrate the overlapping computed for series of measurements and their respective measurement errors (indicated by vertical dashes)-- the orange line indicate filter mean estimation and red/blue lines indicate uppler/lower (+/- stdev) of the Kalman Filter state uncertanty estimation. It's clearly seen that when/if measurements with their possible error interval is to far away from what Kalman Filter would "assume to be realistically possible" -the value of overlapping graph goes down to almost zero, thus possible to identify outliers. However, several sequential outliers may actually mean the "change of situation" that Filter failed to capture. Will add some thoughts how to recognize & handle this situation a little later with Kalman Filter "Control" feature.

$\endgroup$

Your Answer

By clicking “Post Your Answer”, you agree to our terms of service and acknowledge you have read our privacy policy.

Not the answer you're looking for? Browse other questions tagged or ask your own question.