I am having an issue which I cannot understand completely. I am working on a simple project where I am testing various algorithms from the family of the Generalised Cross Correlation [GCC] for Direction-of-Arrival [DoA] estimation (actually it's Time-Difference-of-Arrival [TDoA] estimation but in the end the angle of incidence is calculated).
I use two omnidirectional microphones (of low quality but I am not sure this plays any important role here) and have tested three inter-element distances of 3 cm, 5 cm and 10 cm. On top of that, I have also run some tests with a simplistic Monte Carlo simulation with the same algorithms. The results in both the measurements and simulations show the exact same trends.
In the simulations I create a random signal (drawn from a Gaussian distribution), then duplicate and add a delay to the second and use those two signals to be fed to the algorithms as input.
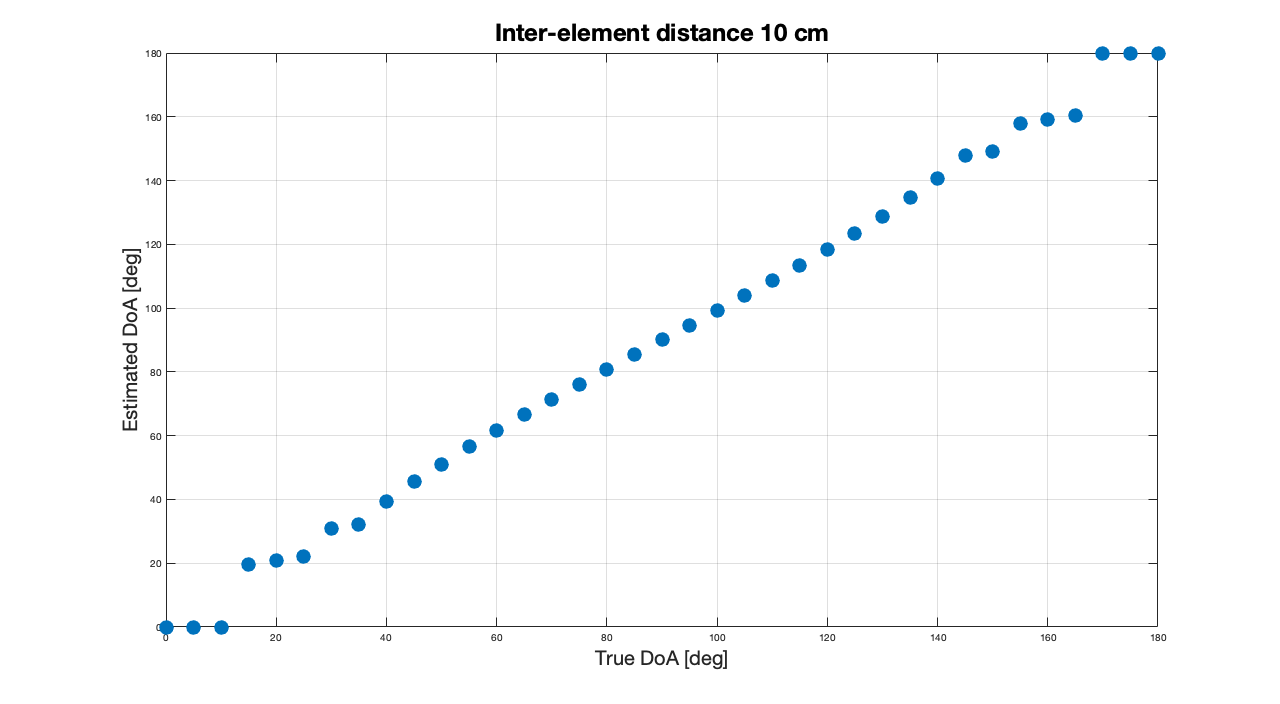
An example of the results I get for the Phase Transform [PhaT] variant is shown in the figures below (for all three setups).
All angles, both true and estimates are measured from the array's axis, with $90^{o}$ representing angles perpendicular to the array's axis and $0^{o}$ and $180^{o}$ angles parallel to the array's axis.
Let me say that I am completely aware of the decrease in effective array's length with increasing angle (from the broadside). I also understand that this may limit the resolution of a Uniform Linear Array [ULA] when it comes to beamforming . I believe I have a basic understanding of how this affects the resolution of the array in this case too, where for greater angles the resolved DoAs get coarser and coarser. Yet, I cannot understand exactly how this is connected/related to the clustering of the estimated values for short inter-element distances, if at all.
I found out in Optimum Array Processing - Part IV of Detection, Estimation and Modulation Theory by Harry L. Van Trees (unfortunately no link to the book, I am sorry), that the Half-Power Beamwidth is given by
$$\theta_{H} = \cos^{-1} \left[ \cos \theta_{T} - 0.45 \frac{\lambda}{N d} \right] + \left[ \cos \theta_{T} + 0.45 \frac{\lambda}{N d} \right]$$
where $\theta_{H}$ is the Half-Power Beamwidth, $\theta_{T}$ is the (steering) angle of maximum sensitivity (the angle at which the array's pattern is steered at), $\lambda$ the wavelength (which means that this is different for each frequency), $N$ the number of sensors and $d$ their inter-element distance. From this formula and its "small angle approximation"
$$\theta_{H} \approx 0.891 \frac{\lambda}{N d} \csc \theta_{T}$$
it can be seen that indeed, for large angles, $\theta_{H}$ broadens, thus effectively diminishing the resolution.
Now, I still can't really make the connection between this broadening and the clustering of the estimates, if there is any of course.
To make sure my approach is clear, in order to get the estimates, I first calculate the cross spectrum of the signals $F_{xy} = X \cdot \overline{Y}$, with $X$ and $Y$ representing the spectrum of each input (their Fourier Transform) and $\overline{[ ~ \cdot ~ ]}$ representing conjugation. I weight the cross spectrum with the appropriate weighting function, which for PhaT is
$$W = \frac{1}{\left|F_{xy} \right|}$$
and then I calculate the cross-correlation function like (this is taken from "Multi-Source TDoA Estimation in Reverberant Audio Using Angular Spectra and Clustering" by Charles Blandin et al.)
$$ r_{xy}(\tau) = \sum_{f = 0}^{f_{s}} \left[ W \cdot F_{xy} \cdot e^{-2 j \pi f \tau} \right] $$
with $\tau$ being the lag between the two signals, $f$ being the frequency (ranging from DC to the sampling frequency) and $f_{s}$ the sampling frequency.
Finally, the argument/index of (where) the maximum of the cross correlation happens shows the delay.
Still, there is no indication in the algorithm as to why this clustering happens and I tend to believe that this is setup dependent as it seems from the data too. If anyone can shed some light into the problem or provide some guidance and directions, it would be extremely appreciated.
Thank you all in advance.


