2
$\begingroup$

I have followed the link below to simulate two different zero-padding methods (zero-centered and causal)

https://ccrma.stanford.edu/~jos/mdft/Zero_Padding.html

Sample code

close all;
clear all;

x           = [3 2 1 1 2];
n           = length(x);

fft_len     = 32;

zeropadd    = fft_len - n;

y           = [x(1:(n-1)/2+1) zeros(1,zeropadd) x((n-1)/2+2:end)];

y_normal    = [y(fft_len/2+2:fft_len) y(1:fft_len/2)];

x_zeropad   = [x zeros(1,zeropadd)];

y_fft       = fft(y);

y_normal_fft = fft(y_normal);

x_fft       = fft(x, fft_len);

x_zp_fft    = fft(x_zeropad);

subplot(421)
stem(y)
xlabel 'n',
ylabel 'y'

subplot(422)
stem(y_fft)
xlabel 'n',
ylabel 'fft(y)'

subplot(423)
stem(y_normal)
xlabel 'n',
ylabel 'y-normal'

subplot(424)
stem(y_normal_fft)
xlabel 'n',
ylabel 'fft(y-normal)'

subplot(425)
stem(x)
xlabel 'n',
ylabel 'x'

subplot(426)
stem(x_fft)
xlabel 'n',
ylabel 'fft(x, fft_len)'

subplot(427)
stem(x_zeropad)
xlabel 'n',
ylabel 'x-zp'

subplot(428)
stem(x_zp_fft)
xlabel 'n',
ylabel 'fft(x-zp)'

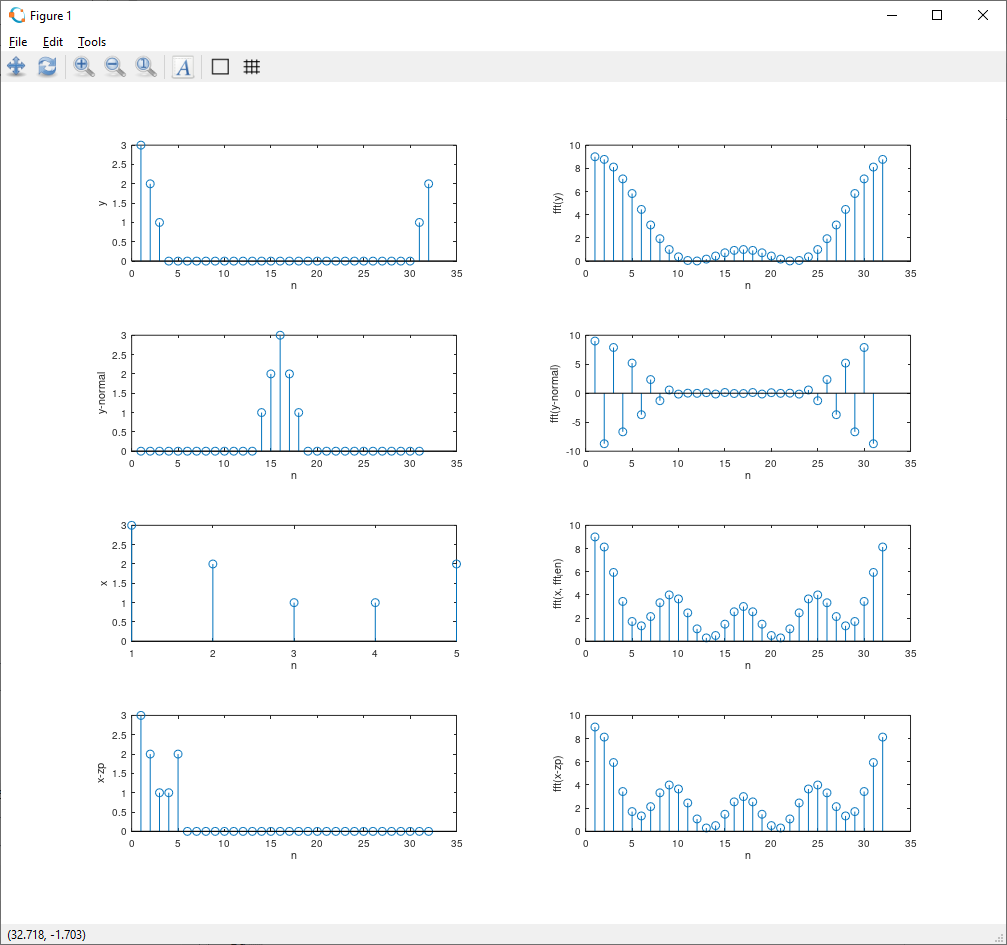
Output is

enter image description here

My question is why is the spectrum of fft(y), fft(y_normal) is different from fft(x) and fft(x_zp)

$\endgroup$

2 Answers 2

1
$\begingroup$

The obvious reason why the DFTs of the x and y signals are different is because the signals themselves are different. Different versions of zero-padding result in different DFTs.

What you probably wanted to show is that the DFTs of the two zero-padded versions of the original signal are interpolated versions of the DFT of the original, unpadded signal. And this is indeed the case. But in order to see this you have to compute the DFT of x without zero-padding and then compare it to the DFTs of the two zero-padded versions of x:

X = fft(x);

Also, you need to choose an FFT length that is an integer multiple of the length of x, otherwise no values of the FFTs of the zero-padded signals will exactly match the FFT of the original signal:

n = length(x);
fft_len = 4*n;
zeropadd = fft_len - n;
y = [x(1:(n-1)/2+1) zeros(1,zeropadd) x((n-1)/2+2:end)];
Xz = fft(x, fft_len);
Y = fft(y);

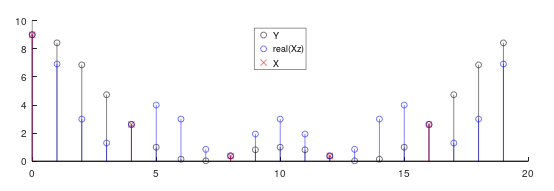
Note that the DFTs of x and y are real-valued (up to rounding errors) because of the symmetry of the two signals. The DFT Xz of the signal with zeros added at the end is complex-valued, because the zero-padded signal is no longer symmetric. However, both Xz and Y are interpolated versions of X, i.e., for the given FFT length, every fourth value of Xz and of Y equals the corresponding value of X.

This is shown in the figure below. It shows X (spread out by a factor of $4$), Y, and the real part of Xz. Note that for indices that are a multiple of $4$ (since we chose fft_len = 4*n), the values of Xz and Y are equal, and they correspond to the values of X. So Xz as well as Y are interpolated versions of X:

enter image description here

$\endgroup$
2
  • $\begingroup$ The spectrum y and x are different. Since they are different signal altogether? I understood the interpolation part but visually the spectrum looks different because they are different signal? $\endgroup$
    – jomegaA
    Commented Nov 29, 2021 at 13:57
  • 1
    $\begingroup$ @jomegaA: Yes, sure, the DFT is unique, so different sequences have different DFTs. $\endgroup$
    – Matt L.
    Commented Nov 29, 2021 at 13:58
0
$\begingroup$

You're plotting the real parts of your FFT results. Rather than doing that, you should plot the absolute value of your FFT results. For example, instead of 'stem(y_normal_fft)' use 'stem(abs(y_normal_ff))'.

$\endgroup$
3
  • $\begingroup$ yes its true and i have seen the fft(y) and abs(fft(y_normal)) matches but the spectrum differs when compared to the causal zero padding. $\endgroup$
    – jomegaA
    Commented Nov 29, 2021 at 11:57
  • 1
    $\begingroup$ Plotting the absolute values will still show a difference between the FFTs of the x and the y signals. $\endgroup$
    – Matt L.
    Commented Nov 29, 2021 at 13:39
  • $\begingroup$ What I am trying to understand is the difference between the spectrum of zero-centered and causal zero-padding signal. If they result in a different signal which seems to be the case, then I have no confusion any more. $\endgroup$
    – jomegaA
    Commented Nov 29, 2021 at 13:47

Your Answer

By clicking “Post Your Answer”, you agree to our terms of service and acknowledge you have read our privacy policy.

Not the answer you're looking for? Browse other questions tagged or ask your own question.