I need to implement a State Variable Filter, like the one I've programmed in C++ (see code below) inside Matlab. I'm only having the recurrence relations for y and s at the moment.
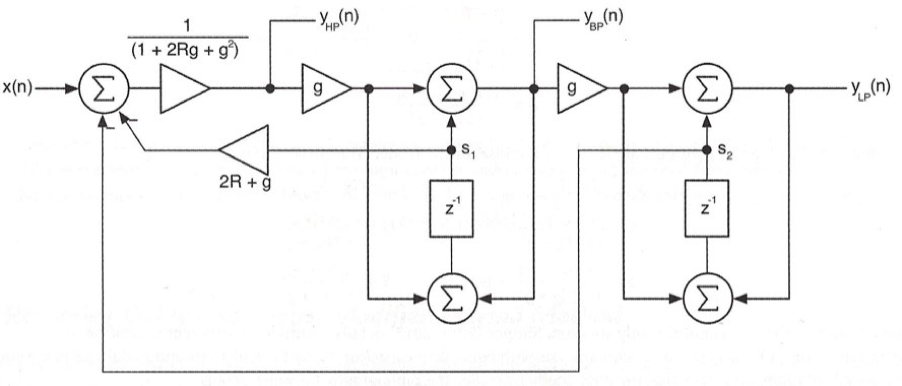
This is the State Variable Filter, taken from the book listed below as a source. 1 The recurrence equations are:
yHP = (1. / (1. + 2. * mR * mG + mG * mG)) * (input - (2. * mR + mG)* mZ1 - mZ2);
yBP = mG * yHP + mZ1;
yLP = mG * yBP + mZ2;
mZ1 = mG * yHP + yBP;
mZ2 = mG * yBP + yLP;

// with

mR = 1. / (2. * mResonance);
mG = tan(M_PI * mCutoff / mSampleRate);
mSampleRate = 44100;
Inside my Code I've written in c++ there's only mResonance and mCutoff to be dealt with. Input would be a impulse, because to get the transfer function of a filter you'd need the impulse response. I would have liked to plot a functional group inside Matlab but I just don't know how, would be really glad if someone could help me out here.
My idea was to copy the code above inside matlab and then simply plot ztrans(yLP), ztrans(yBP) and ztrans(yHP) with different cutoff & resonance parameters in one single graph resulting in a functional group. However this didn't work out, since Matlab gave me the repot that some values would be unknown after every line of code... It seems it can't work with unknown parameters.
I've been thinking this gotta be so easy, doesn't it? How can I plot the transfer functions of this filter, my brain is melting...
1 Figure 4.20 from Designing Software Synthesizer Plug-Ins in C++: For RackAFX, VST3, and Audio Units by Will Prikle (Found it on google, so i figured it would be no problem to show here)
(I also asked this question on Stackoverflow)

