3
$\begingroup$

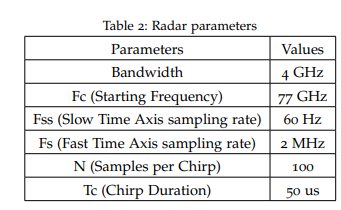
Interested to design and simulate FMCW radar for Vital Signs sensing. The initial signal parameters are(1):

enter image description here

When using the following Matlab code to generate the waveform:

fc = 77e9;
c = 3e8;
tm = 50e-6;                        
bw = 4e9;            
fs = 4e9; 
waveform = phased.FMCWWaveform('SweepTime',tm,'SweepBandwidth',bw,...
    'SampleRate',fs);

sig = waveform();
subplot(211); plot(0:1/fs:tm-1/fs,real(sig));
xlabel('Time (s)'); ylabel('Amplitude (v)');
title('FMCW signal'); axis tight;
subplot(212); spectrogram(sig,32,16,32,fs,'yaxis');
title('FMCW signal spectrogram');

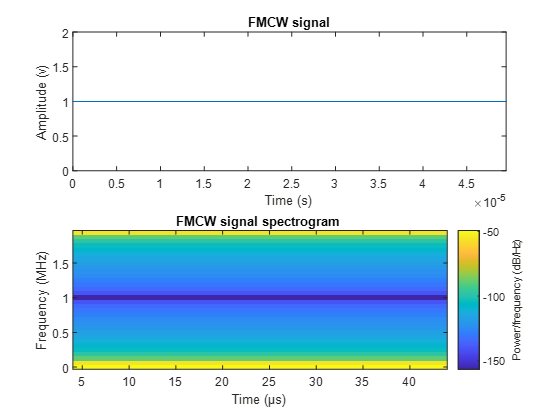
The results are: enter image description here

When the fs is increased to 4GHz, the results are as expected.
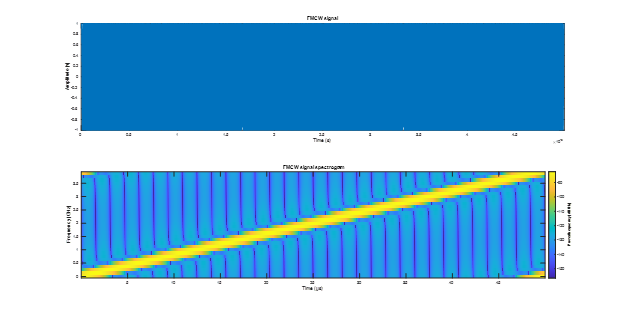
enter image description here Wondered what is the sampling frequency to be used in the Matlab simulation.

(1) https://www.diva-portal.org/smash/get/diva2:1326071/FULLTEXT02.pdf

$\endgroup$

2 Answers 2

1
$\begingroup$

By looking at the table, it seems to me that the sampling rate is $2 \text{ MHz}$. I came to that from $\frac{\text{Samples Per Chirp}}{\text{Chirp Duration}}$, which also matches up with what I expected that this is what the paper calls the "Fast Time Axis sampling rate". They may also show results for a $4 \text{ MHz}$ setup as well, see this excerpt from page 18 of the pdf:

A text file containing the configurations of the radar must be provided to the radar at the boot up sequence. As mentioned, two different scenarios (measurement from back and front) are defined for the measurements of vital signs using the EVM. A couple of chirp parameters are different in the configurations. In the back configuration there is an ADCsampling rate of2 MHz (2000 Ksps) with 100 ADC samples per chirp, while there is an ADC sampling rate of 4 MHz (4000 Ksps) with 200 ADC samples per chirp in the front configuration. The sampling time or the chirp duration which is calculated from the division of number of ADC samples per chirp by ADC sampling rate for both configurations is 50 μs.

I read this to be the conventional sample rate that everybody thinks of. They also have the "Slow Time Axis sampling rate", which is how often they take a frame of samples and feed that into their processing. I think I'd call this something different, like "Frame Rate", since it really is independent of how many samples are taken per second. All this is explained on page 18-19.

$\endgroup$
1
$\begingroup$

It seems that the confusion occurs due to you wanting to visualize the 4 GHz chirp itself versus the beat frequency signal that is yielded after mixing, which is what is ultimately used for detection in FMCW radars. These are two different signals!

This is why the 2 MHz sampling rate does not work: it is much much lower than what the minimum requirement is for a signal that has a bandwidth of 4 GHz. Once you set the sampling rate to 4 GHz, which is the theoretical minimum for a complex signal, you see what you expect in your spectrogram.

For the FMCW radar, the 2 MHz sampling rate is used to sample the resulting beat frequency which has a much lower sampling requirement.

If you want to model this in MATLAB, you can definitely deal with sampling a chirp at 4 GHz (or higher) and mix down to get the beat signal if you wish. You can avoid this by going straight to the beat signal that is yielded after mixing, which as we already said has a much lower sampling requirement and thus is easier to handle.

$\endgroup$
2
  • $\begingroup$ @SenSen You should remove the additional question from here and start a new one. $\endgroup$
    – Envidia
    Commented Sep 15, 2020 at 21:51
  • 1
    $\begingroup$ Thanks @Envidia. Removed and posted a new one. $\endgroup$
    – SenSen
    Commented Sep 16, 2020 at 2:44

Your Answer

By clicking “Post Your Answer”, you agree to our terms of service and acknowledge you have read our privacy policy.

Not the answer you're looking for? Browse other questions tagged or ask your own question.