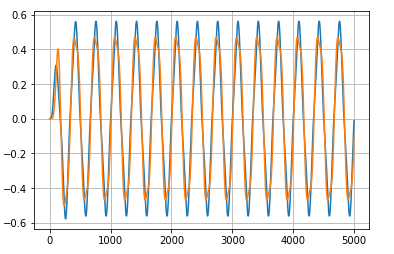
I'm trying to implement a low pass filter in python for a complex signal but the output doesn't look right. I've created a simple example below where I've mixed a 15Hz complex sine wave and a 30Hz complex sine wave so that I get a signal with components (30+15=45Hz and 30-15=15Hz).
What I'm trying to do is filter this signal with a low pass filter to just give the resultant 15Hz component. When I look at the plot of the filtered signal though the imaginary component seems to be almost identical (same phase) as the real signal. It doesn't look right.
Example of code to reproduce then plot below:
import numpy as np
import matplotlib.pyplot as plt
from scipy.signal import butter, lfilter
import scipy.signal as sig

#Sample rate.
rate = 5000

# Create a 15 Hz comlex signal.
t = np.arange(0,5000)/rate
f1 = 15
msg =  np.exp(1j* (2*np.pi * f1 * t))

# Create a 30 Hz complex signal.
f2 = 30
bb_lo = np.exp(1j * (2*np.pi * f2 * t))

# Create a low pass filter to remove the upper frequency.
nyq = 0.5 * rate
cut = 30
low = cut / nyq
b, a = sig.butter(5, low, btype='low')

# Mix the low frequency and high frequency signal together.
# Will result in a signal with freq components of f1+f2 and f2 - f1.
# Then apply the filter to real and imaginary parts.
signalFilt = lfilter(b,a , bb_lo.real*msg.real) + 1j*lfilter(b,a , bb_lo.imag*msg.imag)

plt.plot(signalFilt.real)
plt.plot(signalFilt.imag)
plt.grid()
plt.show()
Frequency filter looks right at approx 15Hz but real/imaginary in plot I don't think should be the same. What am I doing wrong here? Thanks

