I changed this Matlab/Octave code to approximate square wave by using combination of Fourier series and Fejér taper:
    % needed for Octave ------------------------------
    pkg load signal
    % ------------------------------------------------

    % Stage 1 ----------------------------------------
    figure
    N=20;                               % harmonics
    fs = 44100;
    fc = 440;
    w = 2 * pi * fc;
    r_start=0;
    r_end=10;
    r_step=1/fs;
    t = r_start:r_step:r_end;           % range
    w_sqr = square(w*t);          % Square wave [-1:1]

    plot(t,w_sqr);
    axis([r_start r_end -1.2 1.2]);
    grid on;
    hold on;
    audiowrite("squarewave.vaw", w_sqr, fs);

    % Approximation: Combined
    % Fourier series-Fejér taper (Tukey window?) -----------
    %i=1;
    %sum=0;
    %r=t;
    %for t=r
    %  for n=1:N
    %    %sum = sum + (2*sin(n*t)+sin(pi*n-n*t)-sin(n*t+pi*n))/(2*pi*n) % Fourier series
    %    %sum = sum + ((1-n/(N+1))*(-1)*sin(n*t)*(cos(n*pi)-1))/(n*pi); % Fejér taper
    %    sum = sum + ((n-2*N-2)*(cos(pi*n)-1)*sin(n*w*t))/(2*pi*n*(N + 1)); % (Fourier+Fejér)/2
    %  end
    %   Ffej(i)= sign(sum)*(1/2) + sum;
    %  i=i+1;
    %  sum=0;
    %end;
    %Ffej=Ffej';

    sum_ = sum((((1:N)-2*N-2).*(cos(pi*(1:N))-1).*sin((1:N).*w.*(0:1/fs:1)'))./(2*pi*(1:N)*(N + 1)), 2);
    Ffej = 2*sum_;
    Ffej = Ffej';

    plot(t,Ffej);
    axis([r_start r_end -1.2 1.2]);
    legend('Square', 'Fourier series-Fejér taper');

    audiowrite("approximated_squarewave.wav, Ffej, fs);
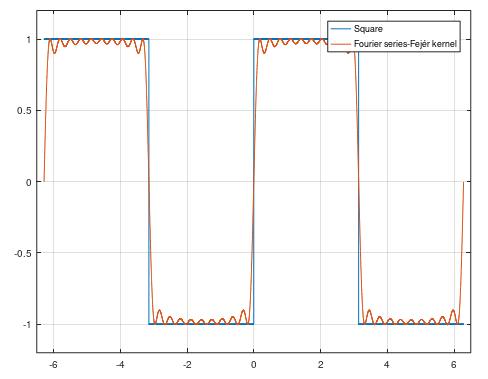
which results this plot:
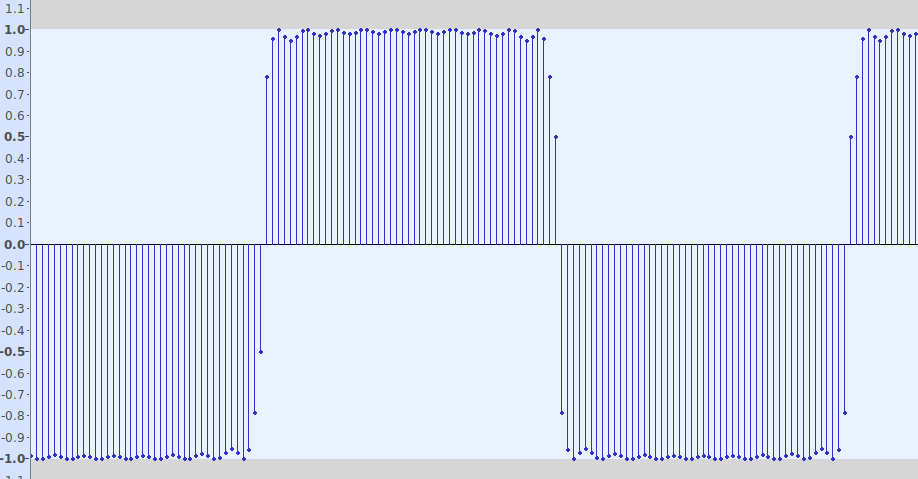
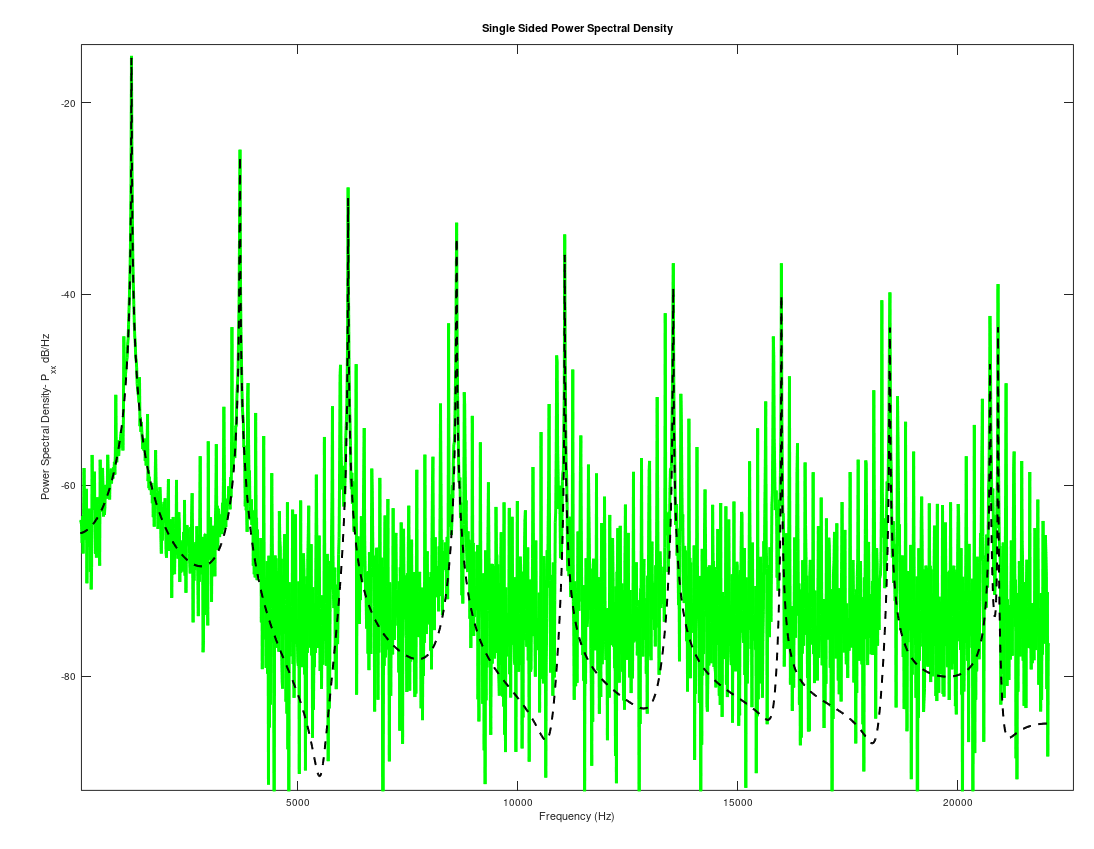
I would like to save these signals to .wav files by using Matlab/Octave audiowrite() command.
What changes are needed to be done in code to save an approximation of 440Hz square wave sound sampled at 44100 Hz? My thought is that range t must be changed to support sample rate range and frequency but, how is the situation with calculation of Ffej ... or is data of Ffej directly usable in audiowrite() command?


