1
$\begingroup$

I am posting a control system problem here because of this post reference.

Question: I have input and output datasets. These are graphically shown below. Input and Output
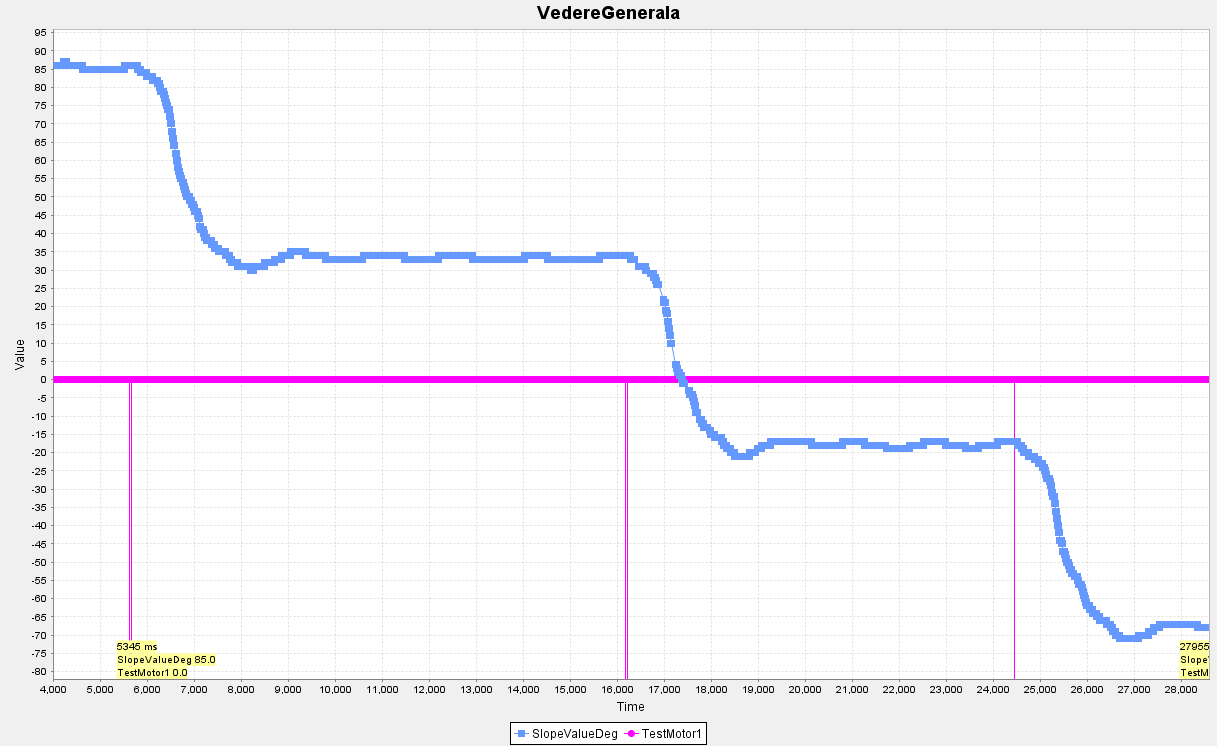
The blue line is output and the pink line is input which was applied during specific time intervals. This dataset has been obtained from a machine that has an existing manually tuned the PID controller.

I want to make an LQI or more perfectly tuned PID controller using bode plots. However, to do that, I will have to identify the transfer function or corresponding state space model.

What is the detailed procedure to obtain the transfer function from the above data set (because this data has been obtained from a machine which already has a manually tuned PID controller controlling it)? The manually tuned values are $K_p=2.2, K_i=0.01, K_d=2$.


My attempt

I used a system identification application and obtained a state space model with a $75 \%$ fit. I tried implementing a PID controller for it and it required large $K_p, K_d, K_i$ values for the required design parameters. State Space Model
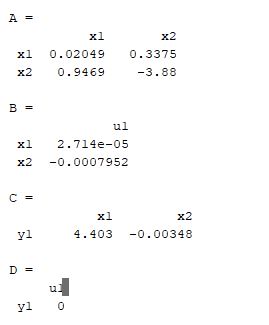
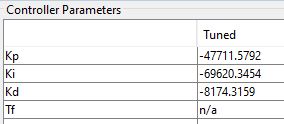
The gain values used were

Gains

These cannot be implemented on a system since it has comparatively very low $K_p, K_i, K_d$ values (manually tuned).

$\endgroup$
2
  • $\begingroup$ Do you mean that you do not have direct access to the plant's input? How did you obtain the state-space model? Is the model you found of the plant or the closed-loop? $\endgroup$
    – Yiftah
    Commented Jul 14, 2020 at 12:34
  • $\begingroup$ Yeah i just got that data and is asked to identify Transfer function or state space model. And i am not sure if it is a plant's model or closed loop $\endgroup$ Commented Jul 14, 2020 at 23:53

1 Answer 1

1
$\begingroup$

Let us denote the output feedback SISO plant transfer function $\frac{Y(s)}{U(s)}=P(s)$ so that the open-loop (OL) transfer function of the system loop is $CP$ where $C(s)=K_p + K_d s + \frac{K_i}{s}$ and the closed-loop (CL) transfer function is $\frac{CP}{1+CP}$. From the attempt at the solution to the problem in the OP, we can see that a second order model might be considered a good idea.

Since the controller transfer function ($K_p, K_d s, {K_i}$) and the system is using direct output feedback, the control input (or actions) may be obtained from the provided data as $u(t) = K_p y(t) + K_d \dot{y}(t) + K_i \int_0^t y(t) \; dt$. The data available is then $\{y(t_i), u(t_i)\}$ which can be directly fed into a system identification tool. Alternately one may used least squares to obtain the second order model parameters ($A, B)$ to fit the state transition model ${\Huge[} \begin{matrix} y \\ \dot{y}\end{matrix}{\Huge]} = A {\Huge[} \begin{matrix} y \\ \dot{y}\end{matrix}{\Huge]} + B {\Huge[} \begin{matrix} 0 \\ u\end{matrix}{\Huge]}$. Care must be taken not to use the CL data to fit the model instead since, as clearly seen from the model, there is no integral term in the state space representation the model is attempting to use. Finally, from a preliminary observation of the graphical representation of the data, the data can be divided into three distinct data set split by time-intervals in which the system undergoes large control actuations which seem to become saturated. These three data sets are observed to have the typical second order behavior reflecting a first or second order system controlled by a PID controller.

$\endgroup$

Your Answer

By clicking “Post Your Answer”, you agree to our terms of service and acknowledge you have read our privacy policy.

Not the answer you're looking for? Browse other questions tagged or ask your own question.