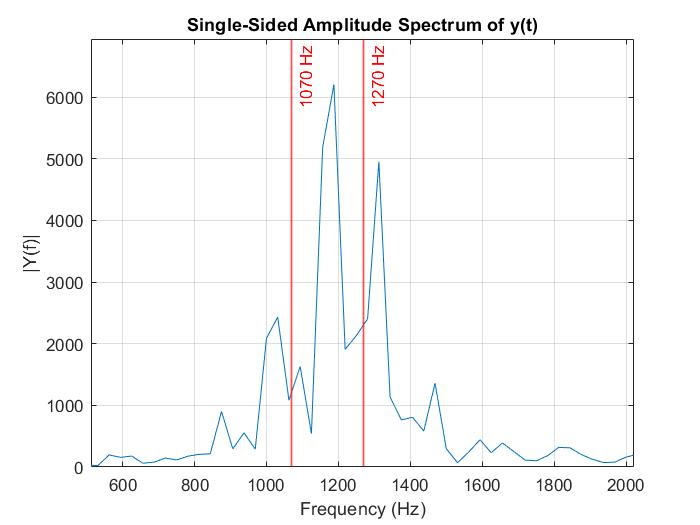
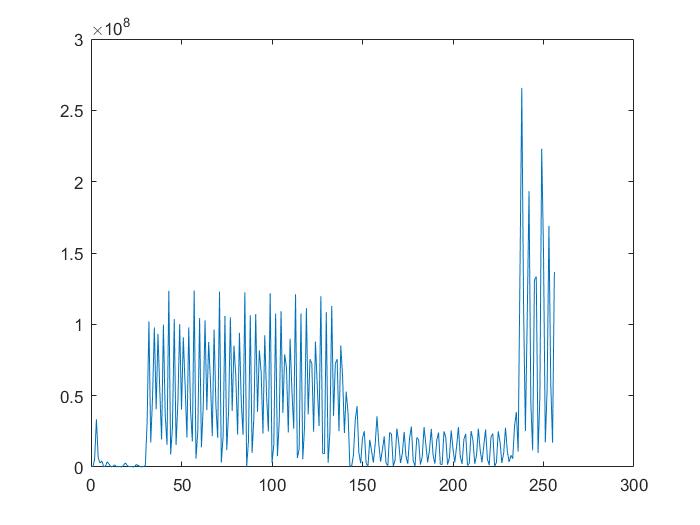
The frequency resolution is independent of the sampling rate. Consider that in the extreme of an infinite sampling rate (continuous time), the Fourier Transform of a single FSK symbol at either 1070 or 1270 Hz carrier will be a Sinc function with the first null at $1/T$ away from the carrier where $T$ is the symbol duration. For a 300 bps data rate, the first null is offset from the carrier by 300 Hz. Clearly this is not orthogonal frequency shift keying since the other symbol is only 200 Hz away, but that doesn't mean the higher transmission data rate can be used, it just means the normalized peak to peak amplitude of the signal out of the frequency discriminator will be reduced due to the cross correlation between symbols.
The OP's sampling rate of 8 KHz is more than sufficient according to Nyquist. An optimum strategy would be to center two bandpass filters (Goertzel is a reasonable approach) at each of the tone frequencies and ensure the bandwidth of each filter is wide enough to allow for the bandwidth of the modulation rate to pass through, which is approximately the data rate, with care that the impulse response of any filtering doesn't cause inter-symbol interference. The larger of the two bins in any given symbol period would be the most likely symbol that was transmitted.
Example 300 bps BFSK Demodulator
Below shows a complete non-coherent FSK demodulator implementation that works up to the higher 300 bps data rate and is very robust against carrier frequency offset (CFO); able to operate with offsets as high as the data rate. This implementation offers a nice balance of efficiency with performance.
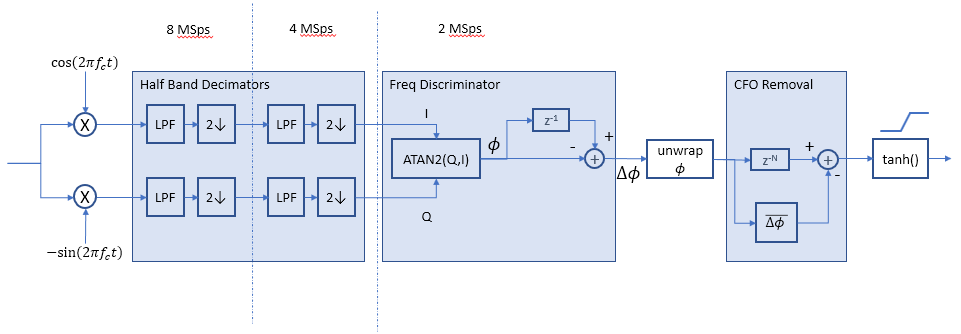
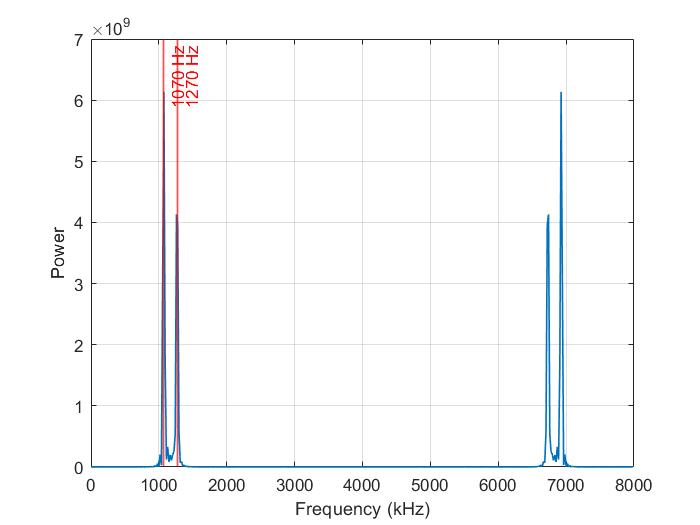
The input modulated signal is frequency translated to baseband by multiplying with $e^{-j 2\pi f_c t}$ where $f_c$ is $1170$ Hz, midway between the FSK symbol frequencies. The creates a complex baseband I and Q output which is then decimated by 4, and the decimation filters efficiently remove the high frequency image of the modulated signal, and then provide a more efficient lower sampling rate of 2 MSps for the rest of the receiver processing. The decimation filters as half-band filters are linear phase filters with every other tap coefficient equal to zero, so very few actual multipliers are required. The code demonstrated here with 17 tap filters requires only 5 multipliers for each filter and provides the following performance in the plots given below, maximizing rejection of the larger high frequency noise component from the frequency translation stage.


The four-quadrant inverse tangent (ATAN2(I/Q) function is used to derive the instantaneous phase of the baseband signal, and then this phase is differenced (approximating the ideal differentiation which converts phase versus time to frequency).
The differenced phase is then unwrapped (so that phase doesn't jump suddenly between $+\pi$ to $-\pi$ when the $\pm \pi$ boundary is passed) by detecting $|\Delta \phi|>\pi$, and adding or subtracting $\pi$ accordingly. The unwrap() function in MATLAB does this under the hood, but convenient here to implement directly since we are taking the difference between successive samples anyway.
The mean value of the unwrapped differenced phase will be proportional to any carrier offset frequency assuming equiprobable data with out an excessively long run of all 1s or all 0s. These factors, as well as the possible rate of change of the carrier offset in dynamic conditions and the acceptable overall delay in the receiver is then considered when determining the number of samples to average over, and then this average is subtracted from a delay-matched copy of the processed signal (matching the delay is only important if the demodulating the initial bits while the offset is being determined is desired, at the expense of overall latency).
Finally large overshoots that may occur at the frequency transitions (especially if the modulation does not transition smoothly from one frequency to the next) are removed through a tanh function, which is reasonably approximated by:
$$tanh(x) \approx \begin{cases}x,& |x|<1\\1,& x>1\\-1,&x<-1 \end{cases}$$
For larger SNR's this can simply be $sign(x)$, but using the mapping above will result in better performance in lower SNR conditions.
After any carrier offsets and larger transition spikes are removed the signal can be further filtered to optimize SNR performance prior to decision. This filtering can be incorporated into the timing recovery, and a very efficient but high performance approach would be to resample with polyphase filters which can provide filtering and fine delay adjustment and operate together with a timing detector as part of a timing recovery loop (for example, see Gardner Timing Recovery for Repeated Symbols and What is the difference of each frequency response of partial filters in a polyphase method).
Here is the result with a random data sequence followed by the demonstration MATLAB/Octave code

Note: it is very important to test with a random data pattern containing both rapid 10101 transitions as well as longer runs. Testing with a repeating 1010 pattern will confirm highest data rate but will also be the most behaved result. Below shows the equivalent result using the OP's modulated data with this demodulator to a repeating 1010 pattern:

Code:
Example modulated data with worst case hard transitions between f1 and f2
fs = 8000;
f1 = 1070;
f2 = 1270;
rate = 300;
#create example modulated data
syms = [1 -1 1 1  -1  1 1 1 -1 -1 1 -1 1 -1 1 -1 1 -1 1 -1 1 -1];
N = floor(length(syms)*fs/rate);
n =0:N-1;
t= n/fs;
data = ones(1, length(n));
sym =  1
for i = [1:length(n)]
    data(i) = syms(sym);
    if (i > floor(sym*fs/rate))
      disp(syms(sym))
      sym = sym+1;
    end
end
fc = (f1+f2)/2;
fd = fc-f1;
fco = 0;     # set to sim carrier freq offset
modx = cos(2*pi*(fc+fco-data.*fd).*t );
FSK Demodulator:
# modulated data at 8 KSps in array modx

t = [1:length(modx)]/fs;  # time vector for array

# Translate to baseband
demod = modx.*exp(-j*2*pi*(f1+f2)/2*t);


# Decimation filter
ord = 16;        #set to multiple of 4
k = (-ord/2:ord/2);
coeff = 0.5*sinc(k/2);
win = kaiser(ord+1,5);
coeff = coeff.*win';

# Half band decimations
demod2 = filter(coeff, 1, demod);
demod2= demod2(1:2:end);
demod4 = filter(coeff, 1, demod2);
demod4= demod4(1:2:end);

# ATAN2 and derivative filter
Q= imag(demod4);
I= real(demod4);
delta = filter([-1 1],1, (atan2(Q,I)));

# Unwrap phase, same as unrwap(atan2(Q,I))
delta2 =  mod(delta+pi,2*pi)-pi;

#subtract mean (CFO removal)
out = (delta2- mean(delta2));

# normalize and eliminate peaking at transitions
outlim= tanh(5*out/std(out));
Another approach that is even simpler is to use a delay and multiply frequency discriminator as as I had further detailed in this post: https://electronics.stackexchange.com/questions/293706/fsk-demodulation-using-dsp/293723#293723. I was not able to create an implementation anywhere close to the performance of the version above at the higher 300 bps rate since after the delay of 19 samples there are only 6 samples remaining within the symbol for the product. However an implementation is further detailed below with good results for the lower 110 bps rate.
The digitally implemented delay and multiply discriminator approach from the linked post is copied below:

Specific to this application for a real signal, the output of the low pass filter is proportional to the cosine of the phase difference at the input to the multiplier Therefore, the delay $T$ is set such that the average frequency 1170 Hz is an integer multiple of 90°, and for a maximum response $T = 1/(2 f_\Delta) = 2.5$ ms, which is 20 samples at 8KHz. At 1170 Hz this is 117°; reducing the delay by one sample decreases T by 125 us and moves the 1170 Hz crossing to $ -79.7°$ best centering the FSK signal in the demodulator within an integer sample delay. This is shown in the graphic below where the blue line represents the discriminator response for a 19 sample delay versus input frequency: When the input is at 1070 Hz the normalized discriminator output is close to -1, and when the input is at 1270 Hz the normalized discriminator output is close to +1.
Frequency Discriminator Response of Delay 19 Samples and Multiply

The multiplier produces the sum and the difference of the input frequency for a real signal. A moving average filter can be used as an efficient low pass filter rejecting the sum products and passing the difference (which is the demodulated signal through).
Resulting FSK Demodulator

Thus for comparison to the Goertzel, we have a complete non-coherent FSK demondulator for a real modulated FSK 1070 Hz/1270 Hz signal sampled at 8KHz, implemented with only a 19 tap delay, 1 real multipliers and 23 adders. The noise bandwidth of this filter is 350 Hz, so with additional filtering SNR can be improved further. Cascading this with a polyphase resampling filter to twice the symbol rate would provide additional filtering with minimum processing, and can be used as the timing adjustment in a timing recovery loop (such as the Gardner loop which operates at 2x samples per symbol).

 The resulting filter output, which I think looks very good:
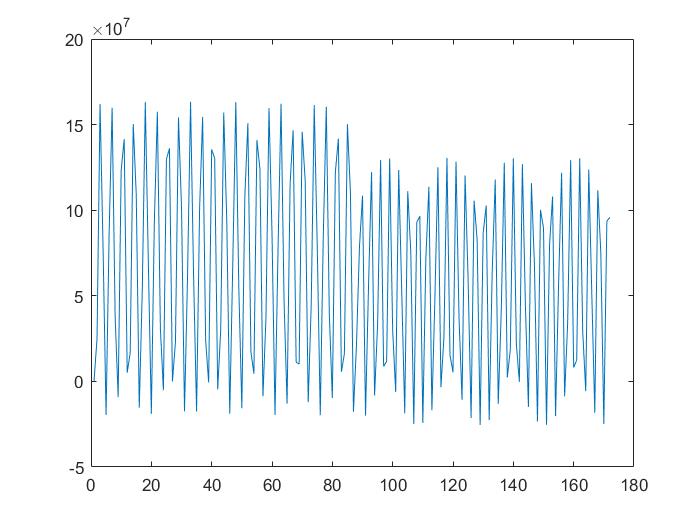 As this looks good, Andy Walls' point saying it could be the Carrier Frequency Offset is worth investigating. Though, I will have to read up on the background first.


