0
$\begingroup$

In a super-resolution task, I try to predict the higher frequencies of a signal. X low-resolution (lr) is my input and Y high-resolution (hr) is the target. Where X contains only frequencies till 2 kHz and Y till 4 kHz.

I would like to know which frequencies in Y have a correlation with frequencies in X. How can I find peaks in both areas (lr and hr) which occur always together? for example, a peak at 1kHz always means there is also a peak at 3kHZ. In general, I would like to find patterns in the low-resolution input that helps me to find a correlation in high-resolution.

My low-resolution signal is generated from the high-resolution signal. It does not contain aliasing, because it was low-pass-filtered and downsampled correctly.

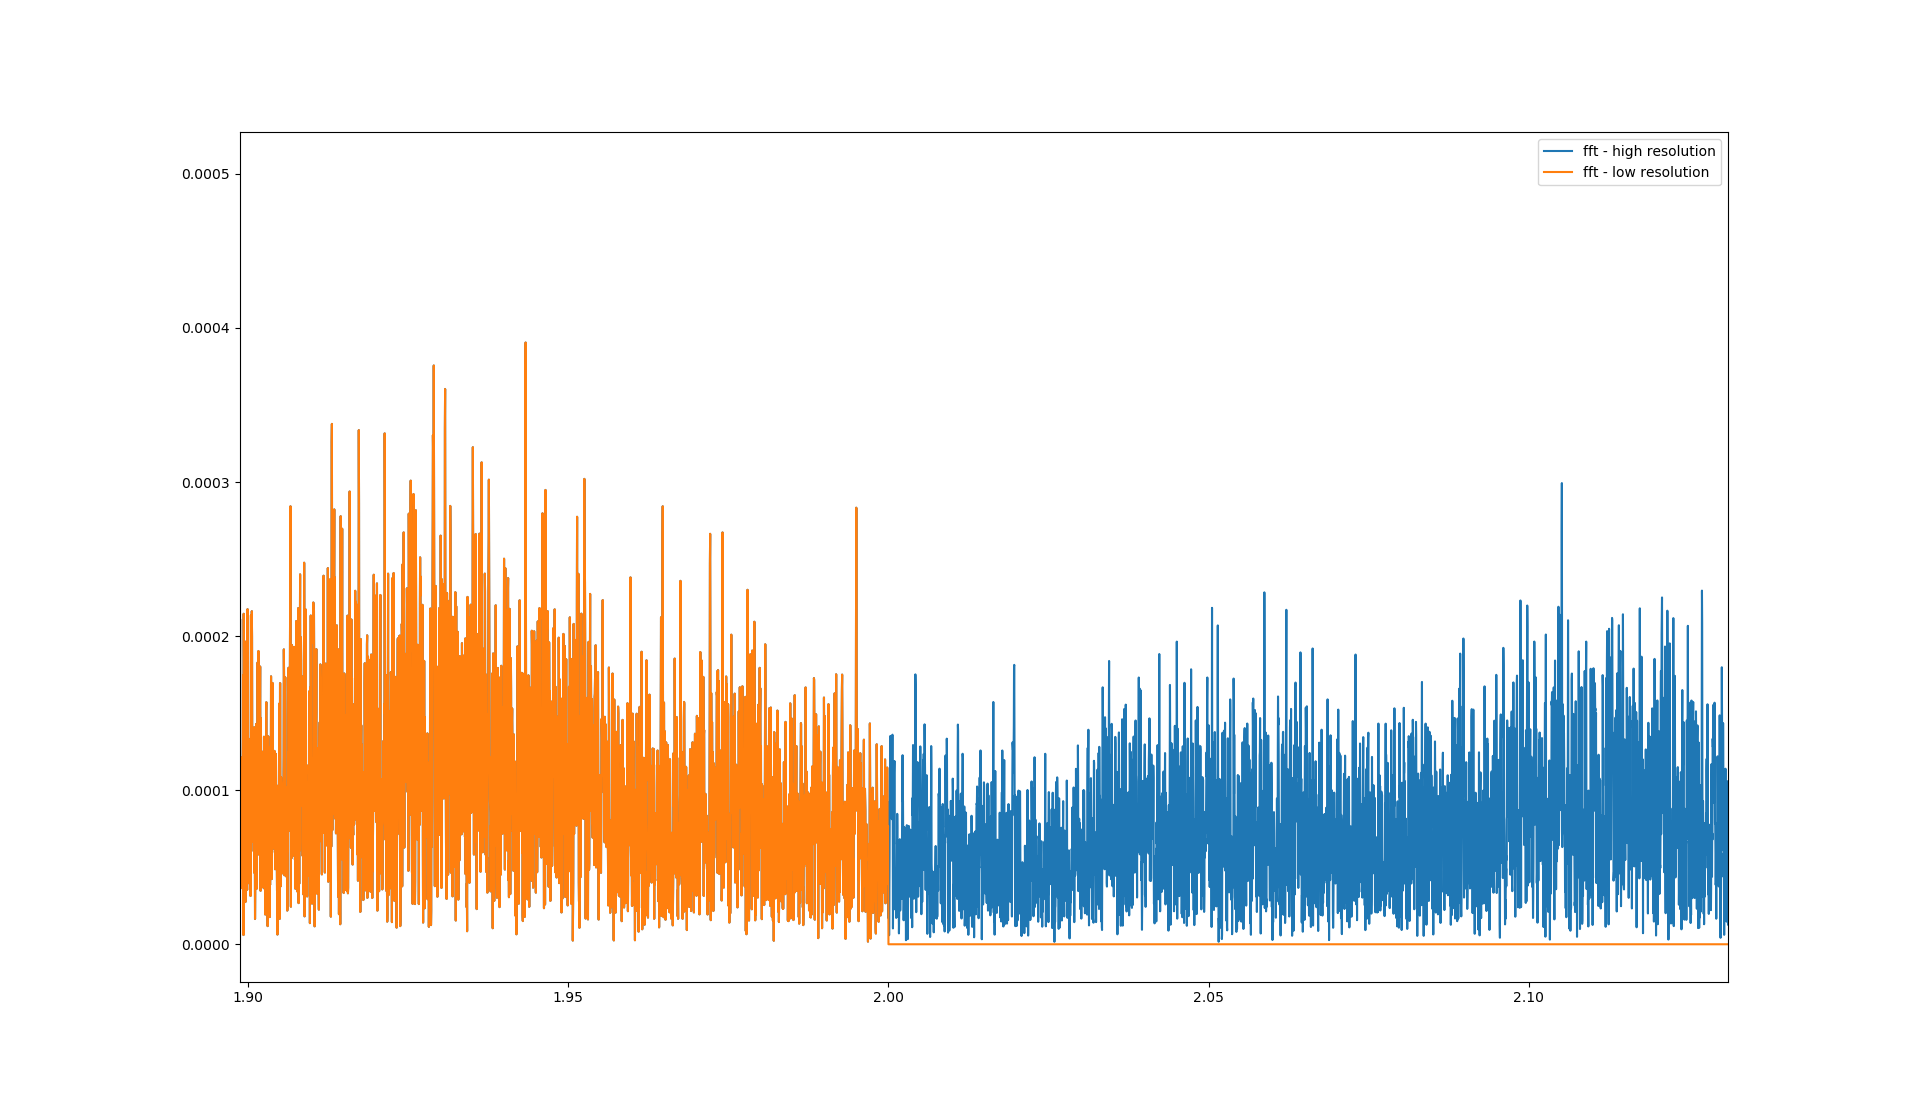
enter image description here As an example plot : the lr and hr spectrum. Lr is generated by low-pass-filtering the hr spectrum. I would like to predict the higher frequencies.The lr image does not contain aliasing. So i need to find patterns in the lr signal for example maybe peaks, which always occur together with peaks in the hr signal. That would mean that there is a correlation between lr and hr.

$\endgroup$
4
  • 1
    $\begingroup$ Can you clarify further what you mean by "occur always together". Do you mean to say that the 1 KHz peak would appear in both and then there would be a peak at 3 KHz, or do you mean if there is only a 1 KHz peak in X there would only be a 3 KHz peak in Y? That said can you write out the formula for the relationship of these frequency locations between X and Y? $\endgroup$ Commented Mar 22, 2020 at 12:44
  • $\begingroup$ ehmm i mean X and Y are actually both the same, the difference is, X is a low-pass-filtered version of Y. Now i want to check which frequency in the low-resolution space has a correlation with frequency in the high-resolution space so i can learn a pattern from low resolution to high resolution $\endgroup$
    – Khan
    Commented Mar 22, 2020 at 13:03
  • 1
    $\begingroup$ Why would any of the low frequencies be correlated to the high frequencies other than integer harmonics? Normally they would be uncorrelated unless there is some relationship in place. What is it about your case imposing this relationship and what would that be exactly (mathematically)? $\endgroup$ Commented Mar 22, 2020 at 13:15
  • $\begingroup$ In my case its machine vibration and iam trying to find a relationship between lr /hr. The lr is a sensor with restricted resolution. And an example usecase would be: is it possible to predict hr frequency with a lr sensor to maybe detect faults with frequencies in hr space. $\endgroup$
    – Khan
    Commented Mar 22, 2020 at 13:20

1 Answer 1

1
$\begingroup$

Your premise is due to the physical nature of the device under test it is possible that occurrence of higher frequencies vibrations can be predicted by lower frequencies and this is important as it will allow you to use a lower bandwidth sensor that can only respond to lower frequencies.

Interesting problem and I would suggest this approach to find evidence of any such correlation:

You will be simply correlating “waveforms” to determine this and in this case the suggested waveform to correlate would be frequency versus time. You can establish these waveforms using a sliding windowed DFT. Decide on a window length (further details on that below) and starting at the beginning of your much longer data captures window a block of the data (more details below) and then use the FFT to compute the DFT for that block. Save the data as time index n=0 and then shift the window by one sample and repeat to get the data to time index n=1. Repeat this to the end of the data set such that the result for each DFT bin represents frequency versus time (a form of the STFT). Once you have this result with frequency bins as columns and time index as rows you can cross correlate all columns to assess if there is anything significant. Anything that does not stand out significantly represents a noise sample, and you can rss all noise samples to get the noise floor of your measurement approach. I would say that anything that is <4 sigma is not significant and anything <2 sigma would reasonably be noise only. You can also do a histogram of the results which should be a standard bell curve but will also help show significant outliers.

Considerations for window size and window choice: with the length of the window you are trading frequency resolution with time resolution: the wider the window the narrower will be the frequency resolution. Specifically if you used a rectangular window the equivalent noise bandwidth of the result is 1 bin wide so the resolution in this case is $f_s/N$ where N is the number of samples or bins in the DFT and $f_s$ is the sampling rate. However the result will be the average frequencies over the time duration of the window so the trade space between time and frequency should be clear.

Next comes the window choice. With a rectangular window (no further scaling of the data prior to taking the DFT) the equivalent noise bandwidth is one bin as mentioned above. This is actually the best resolution you can achieve with the approach I describe as any other window will make the resolution wider. However most importantly is that with the rectangular window the shape of the equivalent filter in frequency is a Sinc function centered on each bin with first null at 1/T or 1 bin away. This means that there will be significant spectral leakage from other frequencies resulting in a false “correlation” if further windowing is not used. Windowing provides a trade of frequency resolution with dynamic range. The rectangular window has the best resolution (narrowest main lobe in its frequency response) but poorest dynamic range (highest sidelobes in its frequency response) compared to all other windows. It is important given your goal to window so that you don’t get a false sense of correlation due to those high sidelobes. I recommend the Kaiser window since you can adjust its Beta term to dynamically make the trade of resolution and dynamic range.

My guess is this would show that there is no significant correlation beyond integer harmonics but without having the mechanical model I can’t be certain of that so this will be interesting to see. If you do proceed with this,please post your results of what you find.
$\endgroup$
6
  • $\begingroup$ thank you for you that nice answer! I have a computer science background and therefore need to understand all the stuff first. But i try to summarize my next steps: i take my waveform, make use of kaiser window, and calculate it for every block. e.g 10 blocks from my waveform. After that i have 10 vectors and use cross correlation to see where it correlates? docs.scipy.org/doc/numpy/reference/generated/numpy.kaiser.html docs.scipy.org/doc/scipy/reference/generated/… $\endgroup$
    – Khan
    Commented Mar 22, 2020 at 14:11
  • 1
    $\begingroup$ No with a moving window of one sample you would have many more than 10 blocks: assume for simple explanation 1000 samples with each block 100 samples long— instead of back to back blocks they are only shifted by one sample- so the first DFT will be n=0 to 99 then the next one would be n=1 to 100 and then n=2 to 101, etc $\endgroup$ Commented Mar 22, 2020 at 14:14
  • $\begingroup$ ah! ok. i shift the window by one data point and not of the length of the window. Got it! Thank you, i come back to you when i have questions :D take care and have a nice weekend. Coronavirus is everywhere :( $\endgroup$
    – Khan
    Commented Mar 22, 2020 at 14:24
  • 1
    $\begingroup$ And then once you have those results, each column is just a waveform and you can use correlation techniques to determine if there is any linear temporal relationship between them. You could also expand this further with a lot more processing to do a cross-correlation function for each of permutations of columns taken two at a time (which includes shifting each in time $\tau$ relative to the other, while my first suggestion is to do a simple correlation with $\tau=0$ which is the dot product using complex conjugate multiplication) $\endgroup$ Commented Mar 22, 2020 at 14:30
  • 1
    $\begingroup$ Arrange the columns so that each column represents a given DFT bin so that each row is the complex value of that bin as you move forward in time. With that you can cross-correlate any two columns to see how they are related for all time that you have. It will be one value showing the correlation (the dot product using complex conjugate multiplication). $\endgroup$ Commented Mar 22, 2020 at 14:43

Your Answer

By clicking “Post Your Answer”, you agree to our terms of service and acknowledge you have read our privacy policy.

Not the answer you're looking for? Browse other questions tagged or ask your own question.