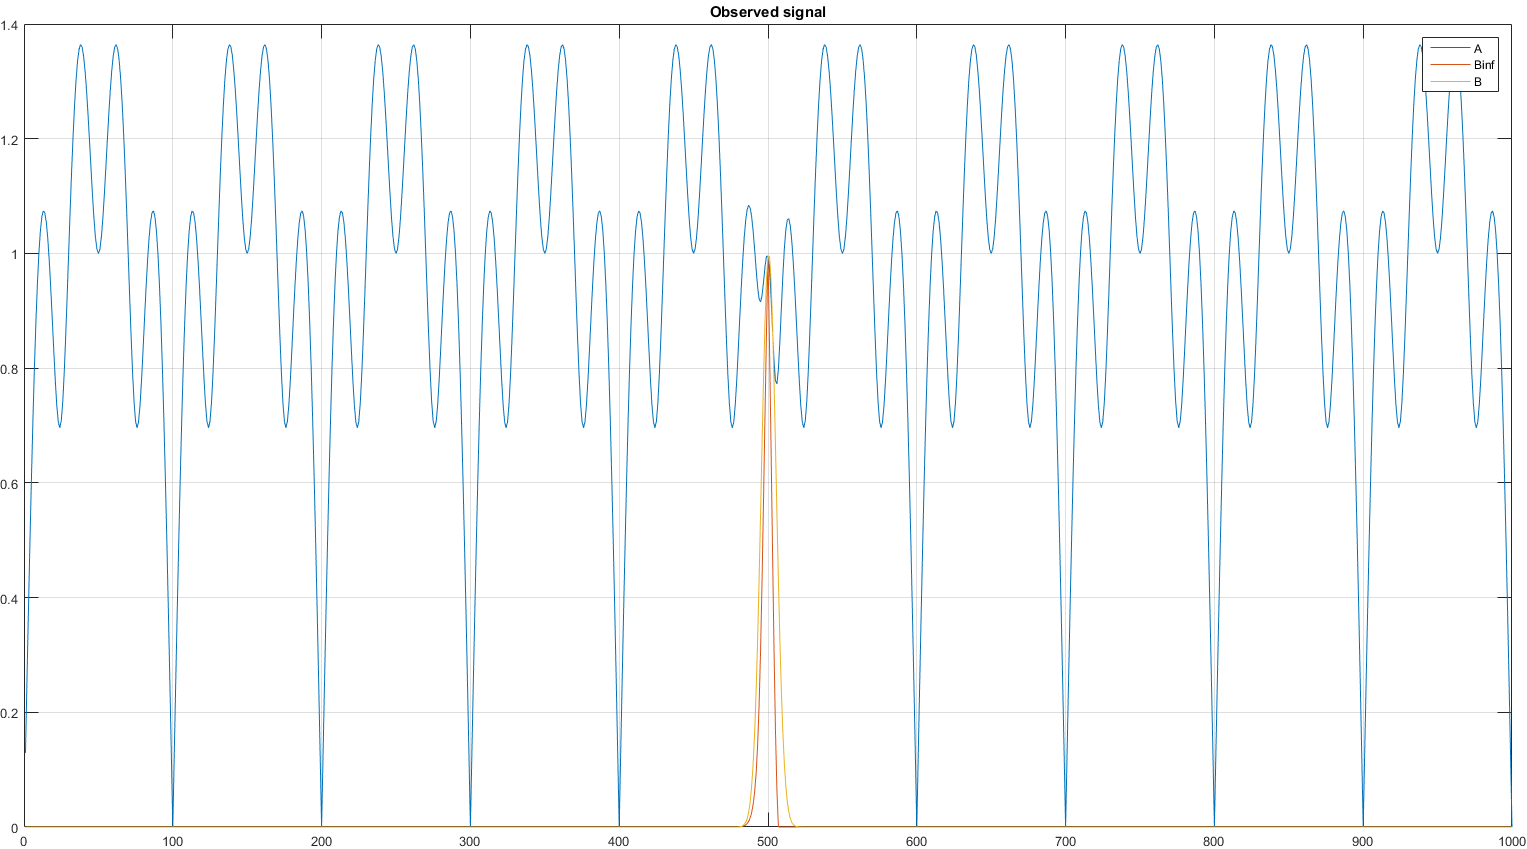
I have an observed signal which is the norm of the sum of two 3-vectors: $$ S(t) = || \mathbf{A}(t) + \mathbf{B}(t) || $$ Now, I have full knowledge of the vector $\mathbf{A}(t)$, $$ \mathbf{A}(t) = \pmatrix{A_1(t) \\ A_2(t) \\ A_3(t)} $$ i.e. I know each of the components $A_i(t)$. The signal $\mathbf{B}(t)$ is unknown, and $S(t)$ is what I observe. Now the signal $\mathbf{B}(t)$ has peaks, particularly in the $B_1(t)$ component, and my goal is to determine the position of these peaks. I don't care about the amplitude of the peaks, I only want the position (time).
So what I need to do is somehow filter out the signal $\mathbf{A}(t)$ from the observed signal $S(t)$ and then apply a peak detection algorithm on the residual signal. My question is whether it is possible to do this?
As a simple example, I made a matlab script to construct synthetic data as follows: $$ \mathbf{A}(t) = \pmatrix{ X(t) \\ Y(t) \\ 0} $$ $$ \mathbf{B}(t) = \pmatrix{ G(t) \\ 0 \\ 0} $$ where $X(t) = \sin{(2 \pi (f/4) t)}$, $Y(t) = \sin{(2 \pi f t)}$, and $G(t)$ is a single Gaussian peak. The signals and matlab script are given below. As you can see, it is not easy to tell that there is a peak in my observed signal at $t = 500$ as there is in the unknown signal $G(t)$.
So is it possible to filter $S(t)$ to remove $\mathbf{A}(t)$ and clearly find the peaks in $\mathbf{B}(t)$?

N = 1000;
t = [1:N];

f = 20;
X = sin(2*pi*(f/4)*t/N);
Y = sin(2*pi*f*t/N);

G = gausswin(N, 100.0);
Z = zeros(1,N);

A = [ X ; Y ; Z];
B = [ G' ; Z ; Z ];
C = A + B;

signal = vecnorm(C);

figure

subplot(4,1,1);
plot(t,X);
title('Known X');

subplot(4,1,2);
plot(t,Y);
title('Known Y');

subplot(4,1,3);
plot(t,G);
title('Unknown signal G');

subplot(4,1,4);
plot(t,signal)
title('Observed signal');

