2
$\begingroup$

I'm trying to compute the PSD using the periodogram method. I have a signal that is periodical at 5kHz. The frequency resolution sought for is 1.221Hz. It's a PRBS signal that has its energy drop to zero at the generation frequency, i.e. 5kHz in this case. The signals i prety much noise clean.

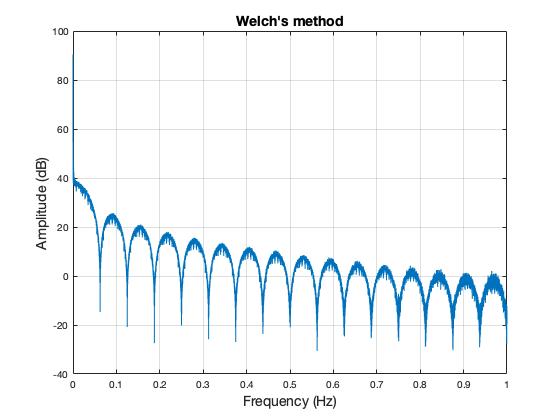
I tried computing the periodogram and I get what I'm after. Then I tried using Welch's averaging method with N = 500 segment length and overlap of 50% and I get something completely different. I would expect to see an exact copy of the periodogram since there is practicaly no noise. Did I completely misunderstood the method?

What I obtain is this: periodogram and welch comparison

I used the following lines of code to estimate the periodogram exactly at the frequencies I want and I scaled the periodogram. ( I have also added .mat files if anyone wants to give it a go)

https://www.dropbox.com/s/pe6qbi883kkocxf/data.mat?dl=0 https://www.dropbox.com/s/2fqmqrg1xpgbibi/freqs.mat?dl=0

load('data.mat');
load('freqs.mat');
1/DT = 5000;
[pxxp,fp] = periodogram(V,rectwin(length(V)),freq,1/DT);
[pxxw,fw] = pwelch(V,rectwin(500),250,freq,1/DT);

semilogx(fp,20*log10(pxxp*8775))
hold on
semilogx(fw,20*log10(pxxw))
$\endgroup$
6
  • $\begingroup$ What is the length of the input? $\endgroup$
    – user28715
    Jan 17, 2019 at 14:05
  • $\begingroup$ 131040 samples. $\endgroup$
    – MarkoP
    Jan 17, 2019 at 14:07
  • $\begingroup$ In one case you average and the other you do not. Why expect the same? $\endgroup$
    – user28715
    Jan 17, 2019 at 14:11
  • $\begingroup$ Use the same window length of you expect to see the same result $\endgroup$
    – user28715
    Jan 17, 2019 at 14:26
  • $\begingroup$ Because I would at least expect to see something similar like here: commons.wikimedia.org/wiki/… I also tried with another signal that has some noise inside and the periodograms are really off... $\endgroup$
    – MarkoP
    Jan 17, 2019 at 14:42

1 Answer 1

1
$\begingroup$

Looks similar to me

>  clear all
>     close all
>     load data
>     samplerate=1
>     periodogram (V)
>     title("Periodogram",'FontSize', 14)
>     xlabel('Frequency (Hz)','FontSize', 14)
>     ylabel('Amplitude (dB)','FontSize', 14)
>     
>     figure
>     pwelch(V)
>     title("Welch's method",'FontSize', 14)
>     xlabel('Frequency (Hz)','FontSize', 14)
>     ylabel('Amplitude (dB)','FontSize', 14)

enter image description here

enter image description here

$\endgroup$

Your Answer

By clicking “Post Your Answer”, you agree to our terms of service and acknowledge you have read our privacy policy.

Not the answer you're looking for? Browse other questions tagged or ask your own question.