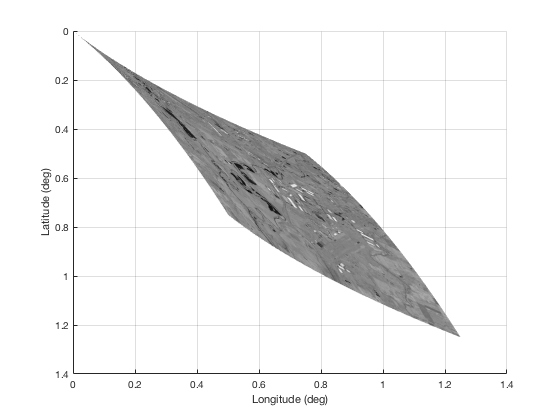
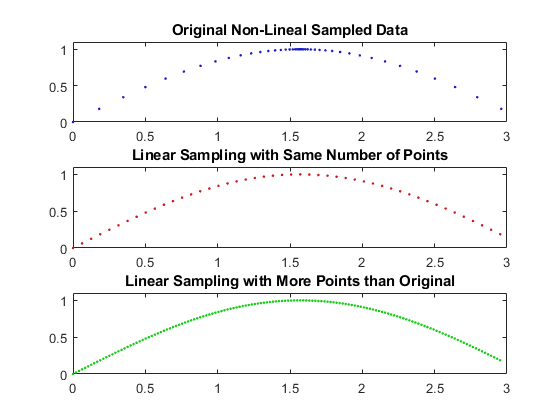
I have an image and associated latitude and longitude matrices. So I know the latitude and longitude of every pixel. However, due to the camera orientation, the image is skewed and thus the latitude and longitude sampling is non-linear. See the images below. I want to resample this image on rectangular, evenly sampled latitude-longitude grid. I have coded up a way to do this, but it's computationally expensive, and I feel certain that there must be a better way. I've done quite a bit of searching, but I haven't found good hits. Perhaps I just don't know the lingo necessary for the right search terms.
The image below is the original image.

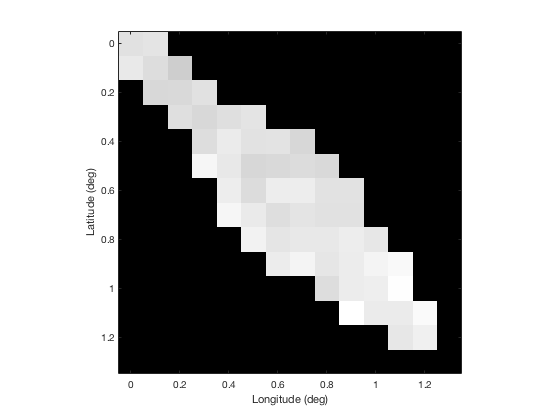
I want to get a resampled image that looks something like this:

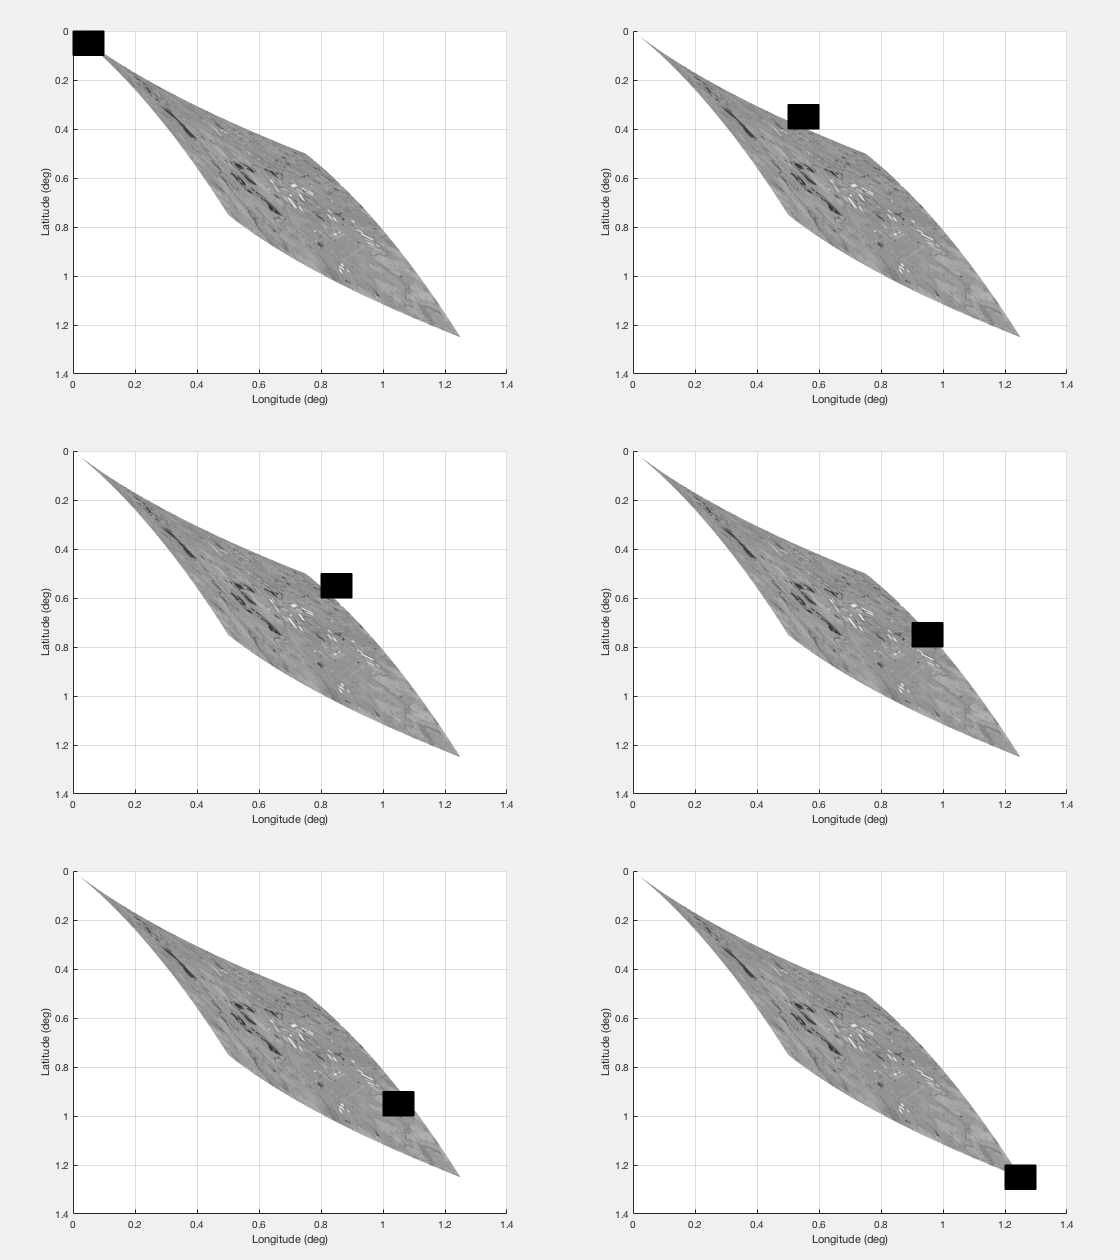
I produced this image, by basically moving a square boolean mask across the original image and finding the mean of the values as shown below:

Ideally, I think that pixels with mostly empty space should have an opacity value as well, but let's table that for now. Here's the MATLAB code I wrote to do this:
%% Create Skewed Image - All of These Are Knowns
rows = 1:size(frame, 1);
cols = 1:size(frame, 2);

% Create non-linearly sampled grid
lat_grid = zeros(size(frame));
lon_grid = zeros(size(frame));
for r = 1:numel(rows)
    for c = 1:numel(cols)
        lat_grid(r,c) = 0 + .001*rows(r) + 1e-3*cols(c) + 1e-6 * rows(r).^2;
        lon_grid(r,c) = 0 + .001*cols(c) + 1e-3*rows(r) + 1e-6 * cols(c).^2;
    end
end

h = figure; surf(lon_grid, lat_grid, frame, 'edgecolor','none'), view([0,90]),
colormap(gray(256))
set(gca, 'ydir', 'reverse')
ylabel('Latitude (deg)')
xlabel('Longitude (deg)')
hold on
filename = 'testAnimated.gif';

%% Create image in target grid
target_lat_array = 0:0.1:(max(lat_grid(:))+0.1);
target_lon_array = 0:0.1:(max(lon_grid(:))+0.1);
[target_lon_grid, target_lat_grid] = meshgrid(target_lon_array, target_lat_array);
resampled_frame = zeros(size(target_lon_grid));
n = 0;
for r = 2:size(target_lat_grid, 1)
    for c = 2:size(target_lon_grid, 2)
        n = n + 1;
        mask = ((lon_grid > target_lon_grid(r, c-1)) & (lon_grid < target_lon_grid(r, c))) & ((lat_grid > target_lat_grid(r-1, c)) & (lat_grid < target_lat_grid(r, c)));
        ph = patch(...
        [target_lon_grid(r, c-1), target_lon_grid(r, c-1), target_lon_grid(r, c), target_lon_grid(r, c)],...
        [target_lat_grid(r-1, c), target_lat_grid(r, c), target_lat_grid(r, c), target_lat_grid(r-1, c)],...
        [1e4, 1e4, 1e4, 1e4], [1,0,0,0.5]);
        if ~any(mask(:))
            delete(ph)
            continue
        end

        % Write to the GIF File
        im = frame2im(getframe(h));
        [imind,cm] = rgb2ind(im,256);
        if n == 1
            imwrite(imind,cm,filename,'gif', 'Loopcount',inf);
        else
            imwrite(imind,cm,filename,'gif','WriteMode','append');
        end

        delete(ph)
        resampled_frame(r-1, c-1) = mean(frame(mask));
    end
end

figure, imagesc(target_lon_array, target_lat_array, resampled_frame),
colormap(gray(256)), axis image
ylabel('Latitude (deg)')
xlabel('Longitude (deg)')
Anybody have any ideas? Like I said, I just feel certain that there must be industry-standard ways to do this.

