A moving average filter can be thought of as a type of low-pass filter that doesn't have any control over its bandwidth for a fixed number of taps.
For a finite impulse response (FIR) filter, the output signal $y[n]$ is given in terms of the input signal $x[n]$ and the filter taps $h[n]$:
$$
y[k] = \sum_{n=0}^{N-1}h[n]x[k-n].
$$
The filter length in this case is $N$ "taps" (or $N$ coefficients). A moving average filter has coefficients that are all equal:
$$
h[n] = \frac{1}{N}, \qquad n = 0, 1, \ldots, N-1,
$$
whereas in general, a low-pass filter (LPF), can have different values for each tap. This allows you to control the frequency selectivity of the filter.
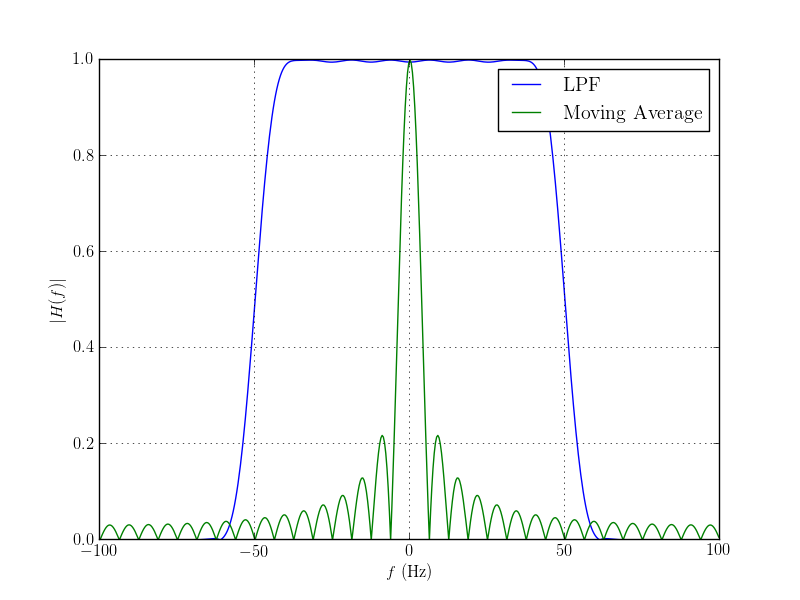
Here is an example showing the difference, for a system with a sample rate of 200 Hz and a filter with 32 taps:

The LPF was designed to have a cutoff frequency of 50 Hz, but it can be set to any value you want. With a moving average filter the filter is narrowly focused around the 0 Hz component ("DC"), and the peak gets narrower the more taps you have in the filter. Another problem with using a moving average filter as an LPF is that it has high sidelobes (the ripples to either side of the main peak) compared to a "properly designed" filter.
The taps for the LPF are:
[-0.00116417 -0.00139094  0.00195951  0.00293134 -0.00437535 -0.00637313
  0.00902803  0.01248116 -0.0169409  -0.02273977  0.03045372  0.04118039
 -0.05729369 -0.08500841  0.14720004  0.45005217  0.45005217  0.14720004
 -0.08500841 -0.05729369  0.04118039  0.03045372 -0.02273977 -0.0169409
  0.01248116  0.00902803 -0.00637313 -0.00437535  0.00293134  0.00195951
 -0.00139094 -0.00116417]
Python code for generating this figure:
from pylab import *
from scipy.signal import windows, firwin


Fs = 200.

N = 32
h_lpf = firwin(N, 50, nyq=Fs/2., window='hamming')
h_ma = ones(N)*1./N

print h_lpf

M = 512


X_lpf = fftshift(abs(fft(h_lpf, M)))
X_lpf /= X_lpf.max()
X_ma = fftshift(abs(fft(h_ma, M)))
X_ma /= X_ma.max()

f = arange(M)*Fs/M - Fs/2.

figure()
plot(f, X_lpf, f, X_ma)
xlabel('$f$ (Hz)')
ylabel('$|H(f)|$')
legend(('LPF', 'Moving Average'))
grid()
show()

