I have the following Room Impulse Response(RIR) in wave format here. I wanted to calculate Reverberation Time (RT60) of it by plotting its Energy Decay Curve using this Python code.
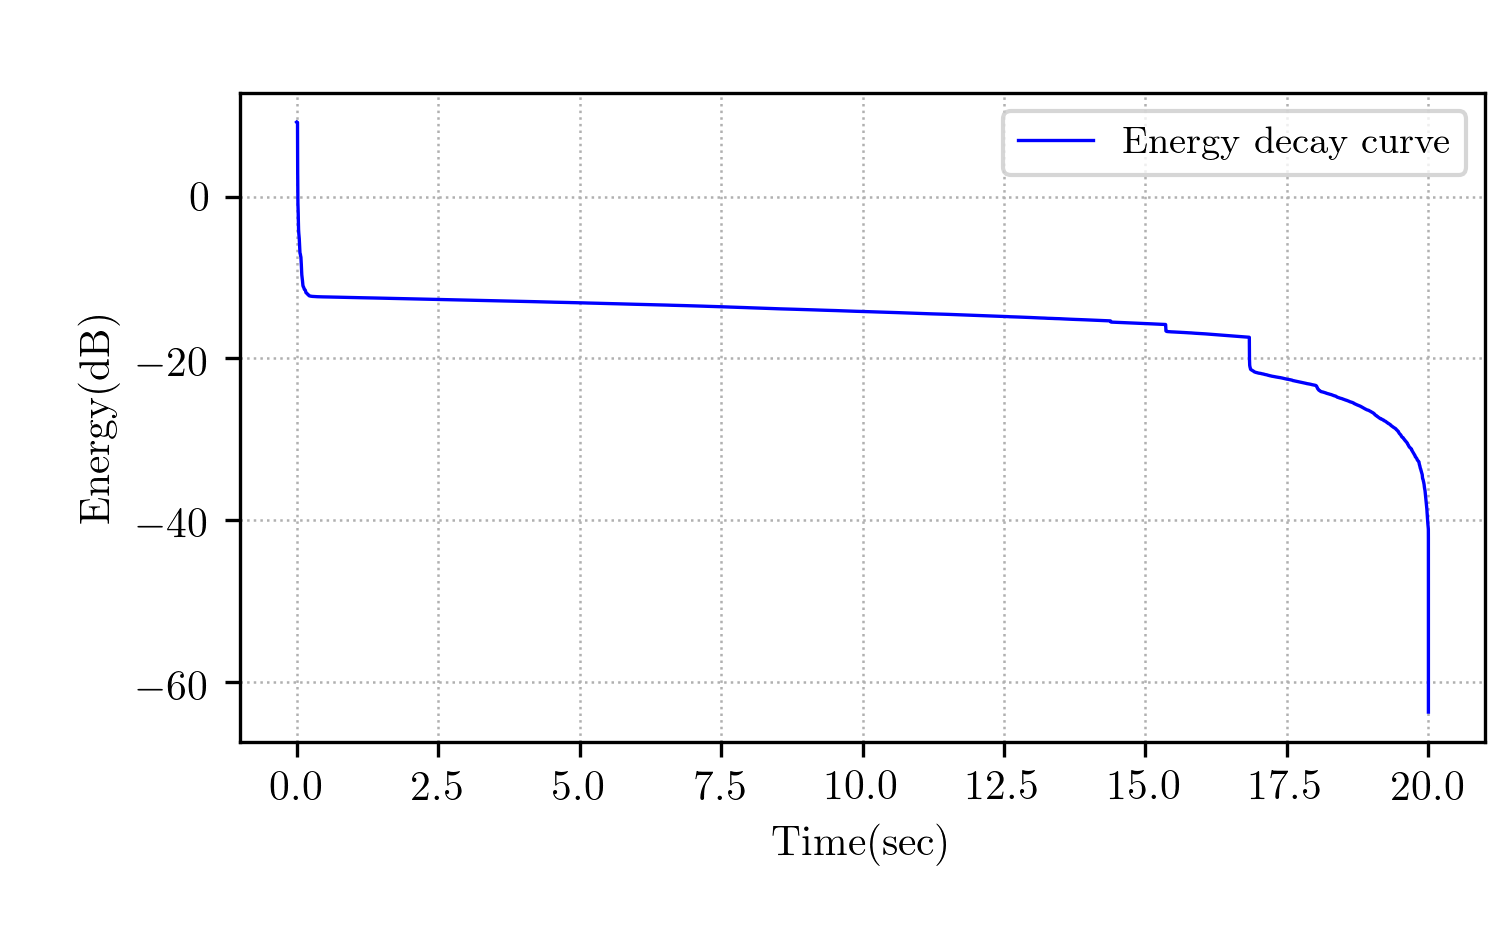
The RIR is mostly zeros after the first 120ms. Plotting the Energy Decay Curve of the whole signal gives the graph below.
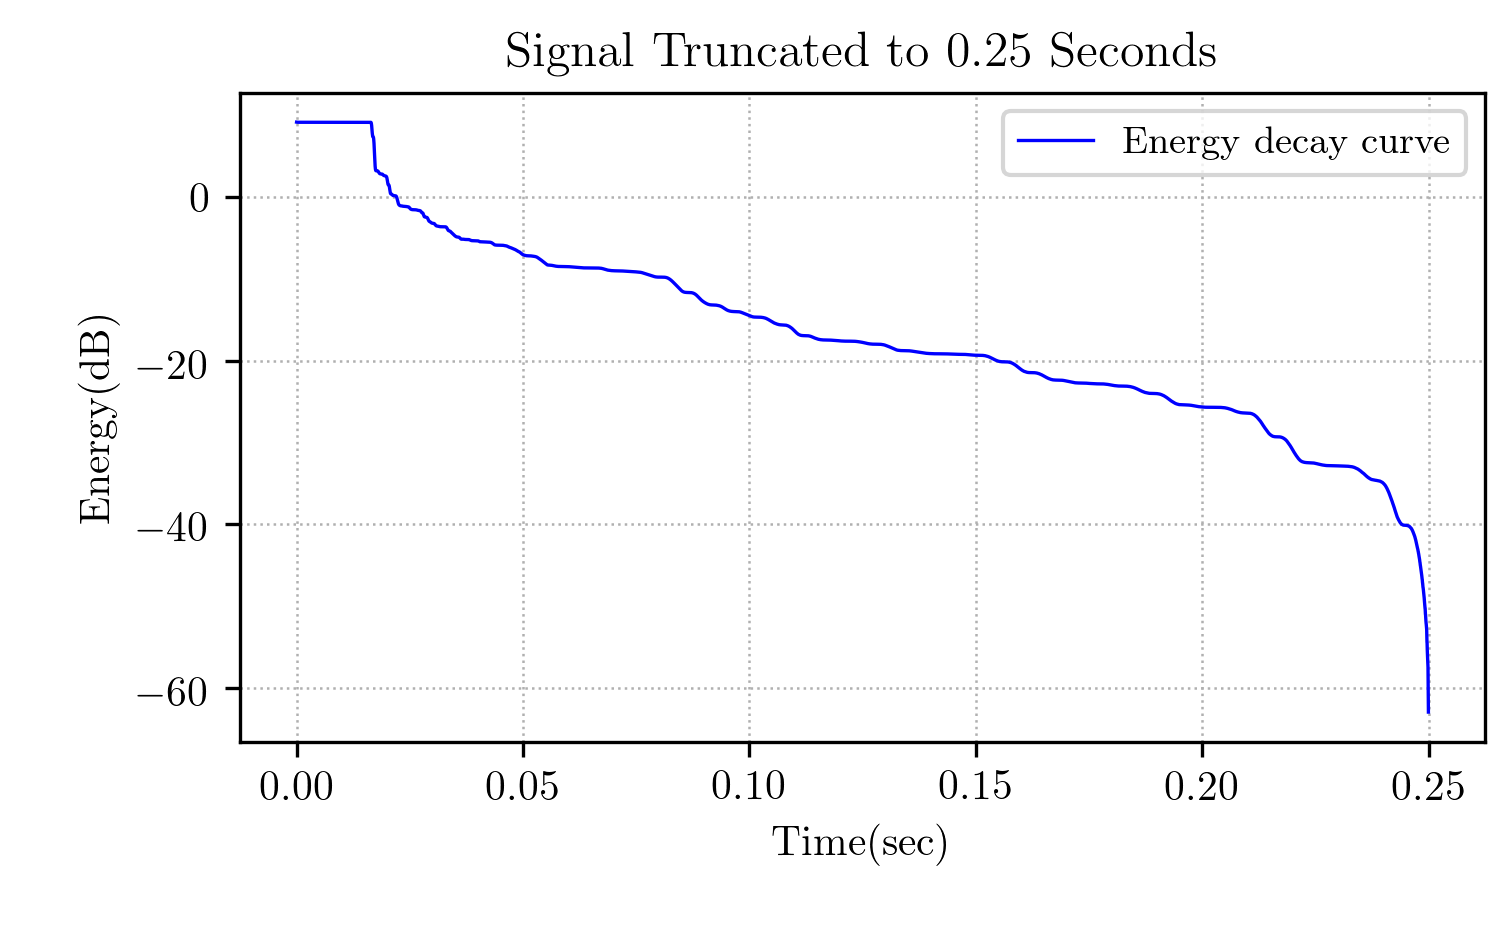
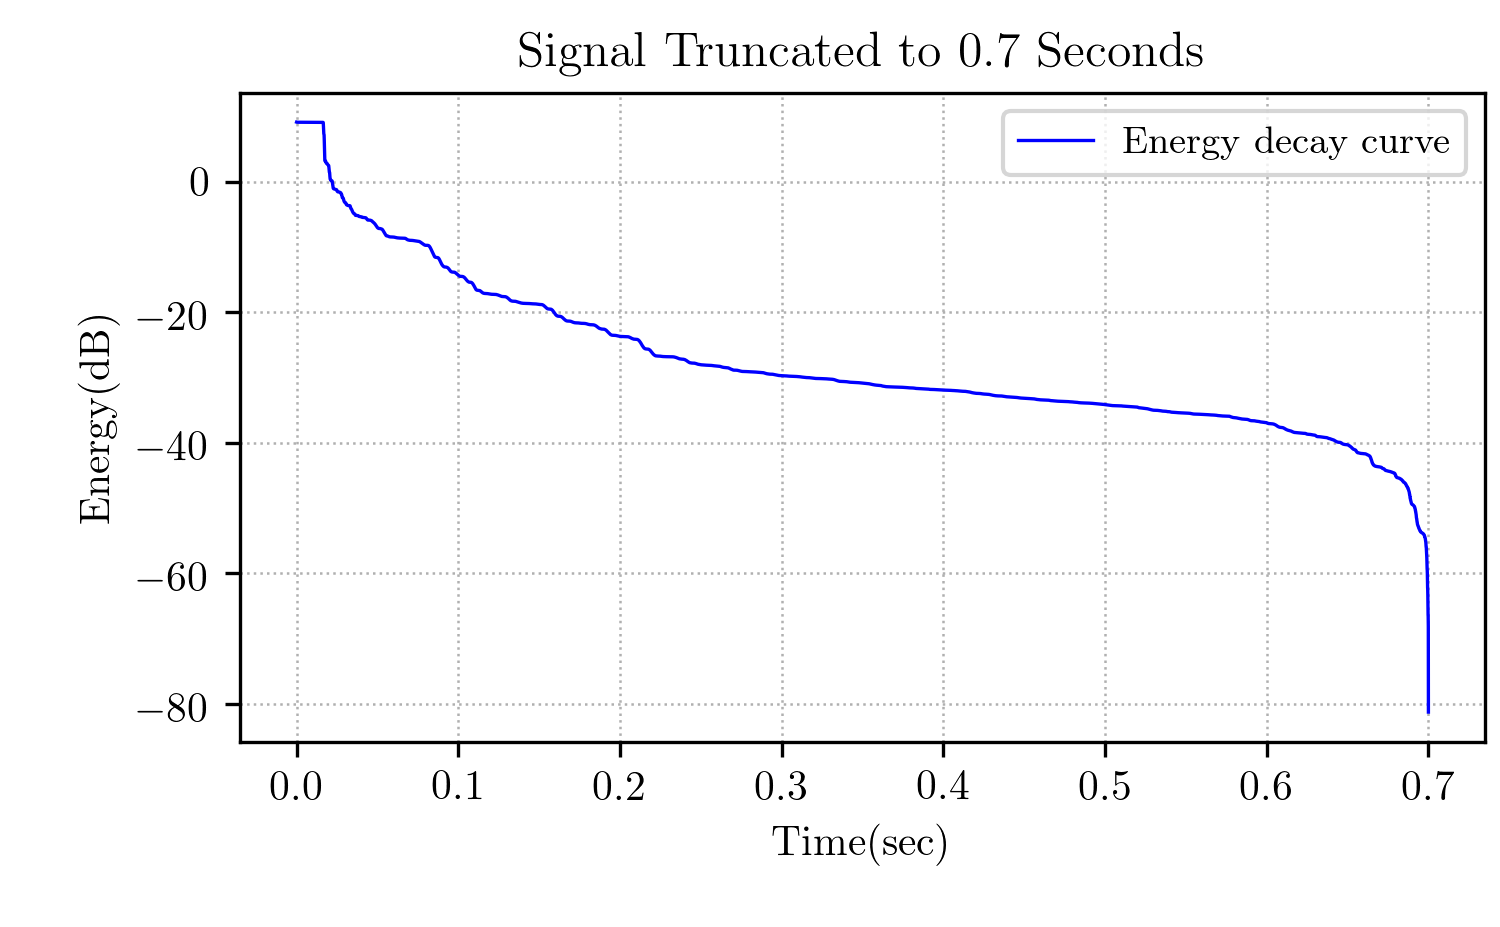
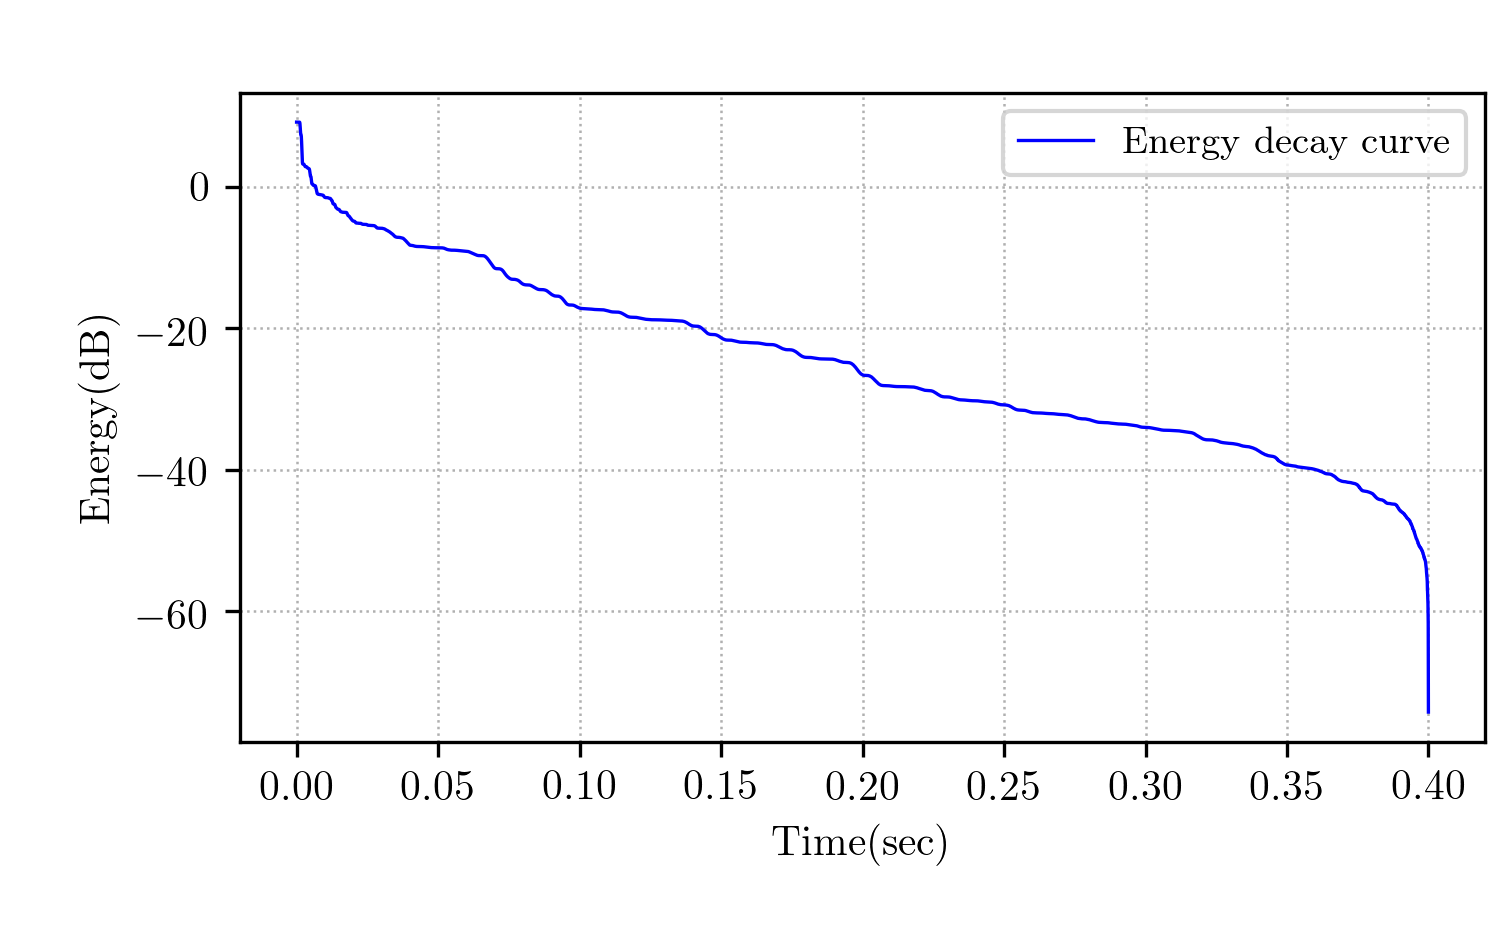
From this graph it looks like after 120ms the signal is decaying very slowly and looks like never going to come down below -60dB, which is confusing to me. If I truncate the signal after 120ms, I am getting different curves for different truncation. It seems like we will get different RT60, depending on how many trailing zeros the RIR has. I went through the MATLAB example here but needs to do the same with Python.
How can I properly calculate RT60 from the RIR using Python code?
What is wrong with my approach here?
- How can few trailing zeros can make difference in the RT60 of an RIR?


