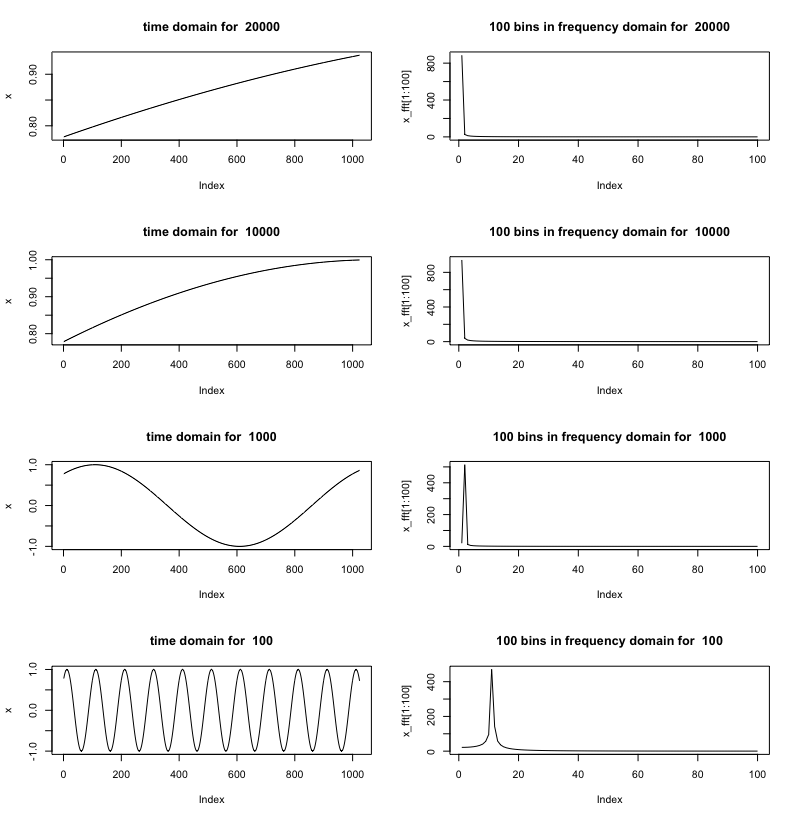
I am computing FFT of the data which I am receiving from an ADC with SPI protocol. Since resolution of FFT is related to $F_s/N$ where $N$ is the FFT length and $F_s$ is the sampling frequency of ADC, when I lower sampling frequency, it should decrease frequency range that I see due to Nyquist–Shannon sampling theorem and conversely it should also increase my FFT resolution.
I am plotting this FFT in realtime and I've given 1 Hz sinusoidal signal via arbitrary signal generator and tested various sampling frequencies to see which point 1 Hz equals to.
╔═══╦═══════════════╦═══════════════╗
║   ║ Sampling Freq ║ Point of 1 Hz ║  0. point included
╠═══╬═══════════════╬═══════════════╣
║ 1 ║ 20k           ║ 3             ║
║ 2 ║ 10k           ║ 6             ║
║ 3 ║ 1k            ║ 9             ║
║ 4 ║ 100           ║ 9             ║
╚═══╩═══════════════╩═══════════════╝
No matter how I lower sampling frequency, it doesn't go further than 9. By the way, my FFT length is 1024.

