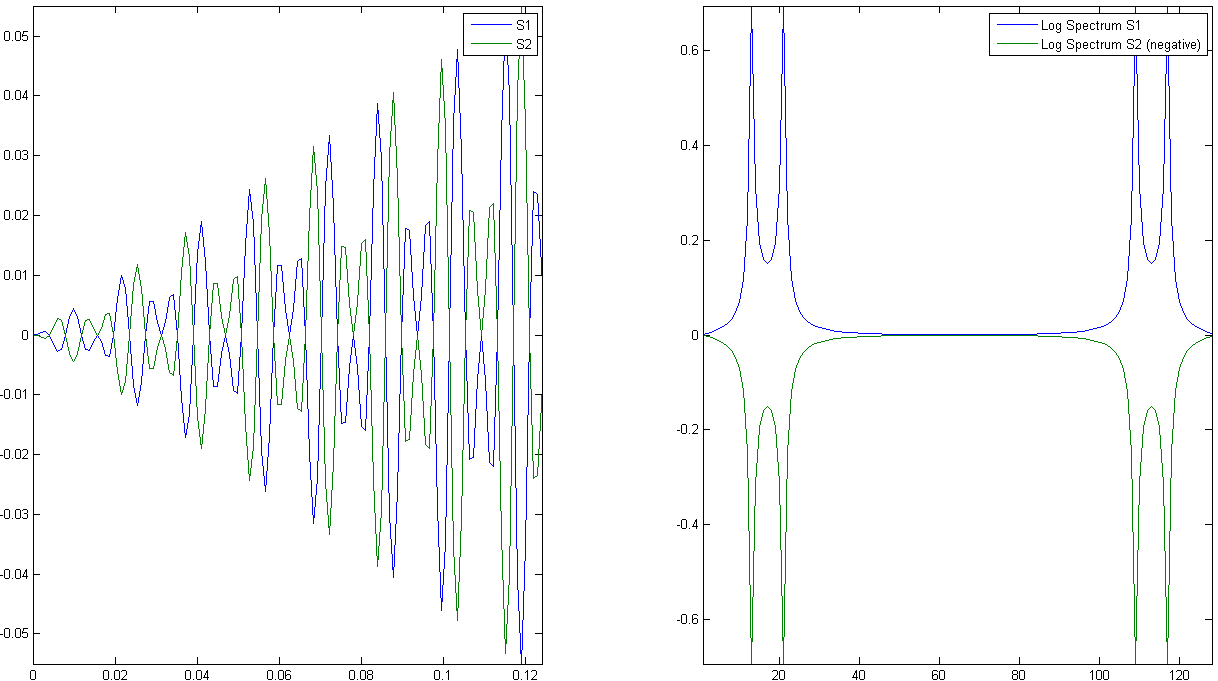
Fourier transforms generally yield complex spectral data. Under some technical conditions, they are bijections. From the Fourier transform, you can uniquely recover one single signal. However, when looking at spectra, the situation is different: signals can have the same amplitude spectrum and very different phases, as in the example below:

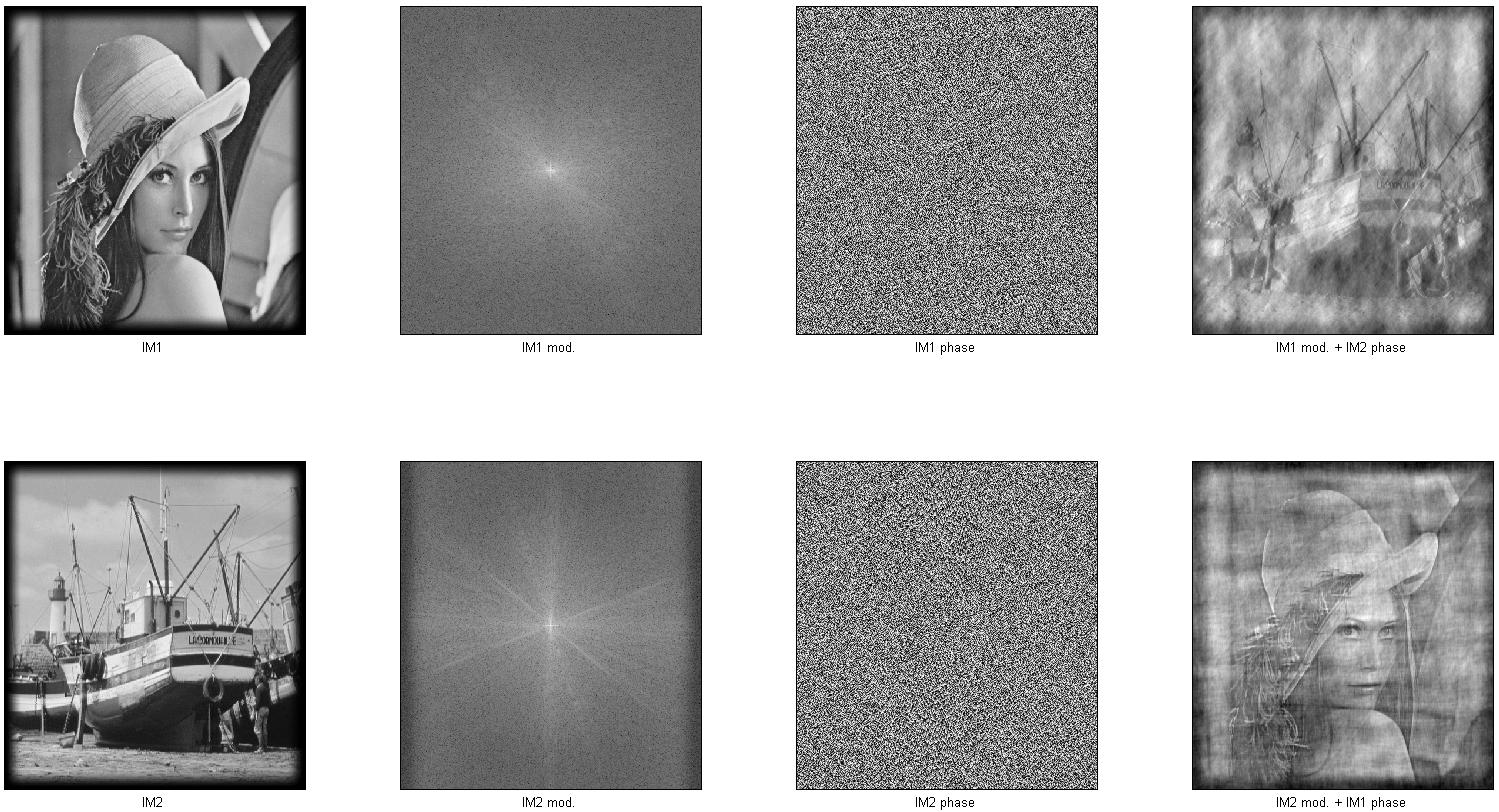
Being bijections, Fourier transforms don't lose time localization; however, amplitude spectra somehow do. One issue is that the phase encodes time or space localization in a way that it is not easy to read or decipher in general. One interpretation is that, for less stationary data, the phase can change very fast, and being known in $]-\pi,\pi]$, it looks like a truncated signal, difficult to unwrap. This can be seen especially for images. Below you have a row for Lenna, and one for the Cornouaille boat.

The second column is the amplitude spectrum. Shaky, but readable. The third column is the unwrapped phase. It seems to have not structure at all. However, it encodes most of the changes in the original image. You can test this by swapping moduli and phases: this is the fourth column. If you take the modulus of Lenna spectrum and the phase of the boat, and do an inverse Fourier transform, you get a ghostly boat, almost no trace of Lenna. You can see the converse on the bottom row. A phase component carries a lot of information, but it is not easy to make sense of it when it is not localized.
One way to localize spectra is to use a window $h$, and you easily get short-time Fourier transforms:
$$ S_s(\tau,f;h) = \int s(t)h^*(t-\tau) e^{-\imath 2 \pi f t} dt$$
but if you consider $h$ as an infinite constant window, then $h^*(t-\tau) $ is constant, and you recover the standard Fourier transform:
$$ S_s(\cdot,f;1) = \int s(t) e^{-\imath 2 \pi f t} dt$$
But people are still trying to understand complex phase patterns, even with short-time Fourier. Windowing does not unveil everything.
[EDIT] Finding a best among time-frequency or time-scale representations is a difficult matter for several reasons (not exhaustive):
- "best" often relate to objective metrics. The traditional trade-off (Weyl-Pauli-Heisenberg) is stated as lower bounds in $L_2$ norms, which is well-suited to dual time/frequency vector spaces. However, it does not tell you much about how the representation is simple, sparse, and many other information metrics (entropies, divergences) are much much informative to that respect, but way much difficult to compute.
- "best" for all data is not so meaningful, one ought to restrict to more specific data models and spaces, and to derive "best" within such classes: piecewise polynomials, sum of peaks...
- digital signals require a discretization of the above continuous schemes, and the way one discretizes has a lot of impact.
- actual measurements do not obey standard assumptions: all is not linear, realizations don't precisely follow theoretical distributions, short data don't get asymptotic properties.
- ultimately, a theoretical best is not the one you can easily parameterize to get reproducible results.
If the morphology of your data is diverse (like spikes + oscillations), you may having to try mastering different tools: frames, unions of bases, data transformations, etc.


