1
$\begingroup$

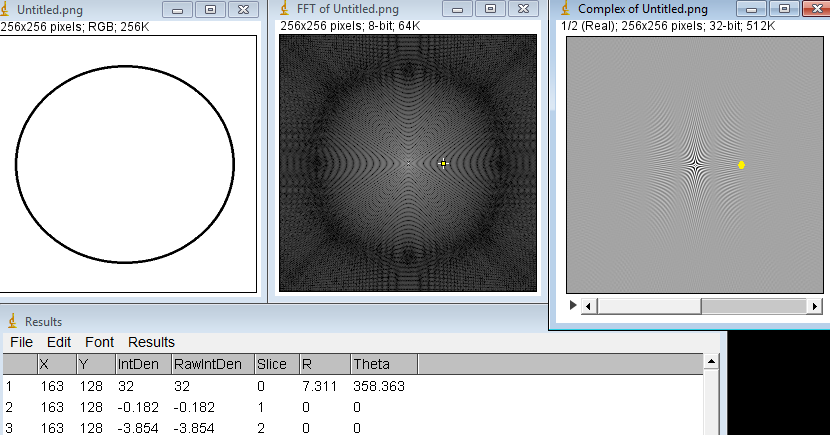
Readings the output of the FFT of the picture of a circle in ImageJ at some random point $(163,128)$ I get $X_{\text{Re}}=-0.182$ and $X_{\text{Im}}=-3.854$, using the Complex plot (yellow dot). The value on the output on the FFT plot is $32$ (cross cursor symbol):

enter image description here

I don't understand why the relation between this latter value ($32$), which I presumed it was the amplitude, and the real and imaginary components, i.e. $\vert X[k]\vert=\sqrt{X_\text{Re}^2+X_\text{Im}^2}$, is not fulfilled.

I had come across the power spectrum logarithmic quote in the ImageJ manual:

The frequency domain image is stored as 32-bit float FHT 
attached to the 8-bit image that displays the power spectrum.

but I can't find a formula to translate the values between the output on ImageJ and the square root. For instance $\log 32 =3.466$, while $\sqrt{(-0.182)^2 + (-3.854)}=3.858$. I wonder if there is some normalization across the image, for example to explain this difference.

This is likely related to the Hartley transform used in ImageJ (page 39).

$\endgroup$

1 Answer 1

1
$\begingroup$

Looking at the source code, the power spectrum image is using a logarithmic scale, adjusted based on the image's dynamic range such that the minimum value (not less than 1) gives a value of 1 and the maximum value gives a value of 254:

if (min<1.0)
    min = 0f;
else
min = (float)Math.log(min);
max = (float)Math.log(max);
scale = (float)(253.0/(max-min));

...
if (r<1f)
    r = 0f;
else
r = (float)Math.log(r);
ps[base+col] = (byte)(((r-min)*scale+0.5)+1);

Making a broad assumption that at least one of those darker pixel is a null would imply that the computed min is close to 0. With this assumption we can proceed to find max as follows:

$$ \begin{align} 32 &= \left\lfloor \ln(3.858) \frac{253}{\ln(r_\max)} + 1.5 \right\rfloor \\ 31 &\approx \frac{253 \ln(3.858)}{\ln(r_\max)} \\ \ln(r_\max) &\approx \frac{253\ln(3.858)}{31} \\ \ln(r_\max) &\approx 11.02 \\ r_\max &\approx 61020 \end{align} $$

Since most of the image is white, I would expect a large spike at the 0 frequency point with an amplitude near $NM = 256^2 = 65536$ (where $N$ and $M$ are the width and height of the image). So $r_\max \approx 61020$ is quite plausible.

So for this image (and this image only, since different images would have a different dynamic range), the approximate scaling would be:

$$ \begin{align} \mbox{value} &\approx \left\lfloor 22.96 \ln(\sqrt{X_\text{Re}^2 + X_\text{Im}^2}) + 1.5 \right\rfloor \\ &\approx \left\lfloor 11.48 \ln(X_\text{Re}^2 + X_\text{Im}^2) + 1.5 \right\rfloor \end{align} $$

$\endgroup$
0

Your Answer

By clicking “Post Your Answer”, you agree to our terms of service and acknowledge you have read our privacy policy.

Not the answer you're looking for? Browse other questions tagged or ask your own question.