1
$\begingroup$

Currently, I am facing a problem about understanding FFT concept and getting exact frequency with acoustic emission sensor data(VDC RMS data).

I want to measure the sound frequency from the acoustic emission sensor VDC RMS data. I am using 8152C Kistler sensor with 5125C0 coupler.I got VDC RMS (Voltage) data from a sensor and saved into an array(ADC output). The below data has 2 types of sounds. I want to know the exact frequency of both sounds.The sampling frequency is $25\textrm{ kHz}$.

  • Is FFT suitable for finding the exact frequency ?
  • How to differentiate different sounds from the sensor?(The VDC RMS is varying with same sound also)

First recorded sound data:

(42,78,111,153,651,1926,3234,4575,5880,7212,8550,9795,10986,12099,12285,12285,12285,12285,12285,12285,12285,12285,12285,12285,12285,12285,12285,12285,12285,12285,12285,12285,12285,12285,11961,11472,10926,10449,9984,9546,9111,8691,8289,7875,7512,7164,6819,6510,6168,5877,5595,5319,5061,4809,4563,4326,4104,3897,3693,3495,3312,3129,2967,2799,2646,2514,2370,2247,2124,2010,1902,1794,1698,1596,1506,1419,1344,1278,1101,1149,1086,1029,972,912,858,813,768,738,711,693,663,636,609,582,555,531,465,498,480,480,453,429,411,381,363,405,318,297,270,246,228,201,180,165,141,126,105,90,72,57,39,33)

Second recorded sound data

(33,39,45,96,135,159,183,201,207,201,210,204,198,189,177,168,147,324,693,1062,1356,1572,1737,1851,1935,1980,2001,2001,1980,1944,1893,1830,1755,1692,1620,1557,1488,1422,1359,1299,1236,1179,1125,1080,1029,984,951,909,858,831,798,753,726,690,654,627,609,579,558,525,504,480,459,435,414,390,369,345,333,315,294,282,261,249,231,210,204,186,174,171,165,147,150,132,135,126,111,105,99,102,90,93,99,129,87,84,84,81,81,87,90,102,114,126,132,135,135,138,138,141,144,153,165,171,183,195,204,204,198,189,189,186,189,195,192,198,213,219,225,234,240,234,240,237,249,240,246,249,252,255,252,246,243,234,231,216,213,219,195,189,180,171,168,159,153,150,144,141,141,144,141,150,156,159,162,156,153,153,159,180,186,204,213,222,228,231,222,213,201,192,186,183,186,177,162,156,153,144,123,132,123,117,108,93,90,84,75,66,66,63,54,57,63,63,63,60,60,66,57,51,57,54,51,48,51,51,60,51,63,54,48,42)
$\endgroup$

1 Answer 1

1
$\begingroup$

Yes an FFT approach will work to identify frequency content, but you may need longer data sets to see something useful. For the FFT you will see the frequencies from 0 to your sampling rate (25000), and there will be the same number of samples in frequency as you have in time. Therefore your frequency resolution is 25000/N where N is the number of samples.

Note, importantly the frequency resolution is dependent only on the time length of your data, T and is independent of the sampling rate. The above relationship works out as if you sample more, N will be proportionally larger in a fixed block of time T.

Therefore

$$ Res = 1/T $$

Where Res is the frequency resolution of your measurement and T is the time length of the data.

For your two datasets, you have 122 data samples for the first one, and and 222 samples for the second; which is 4.42 ms and 8.84 ms of data. The frequency resolution is 25000/122 = 204.92 Hz for the first block data and 25000/222 = 112.61 Hz for the second block (or 1/4.42 ms and 1/8.84 ms).

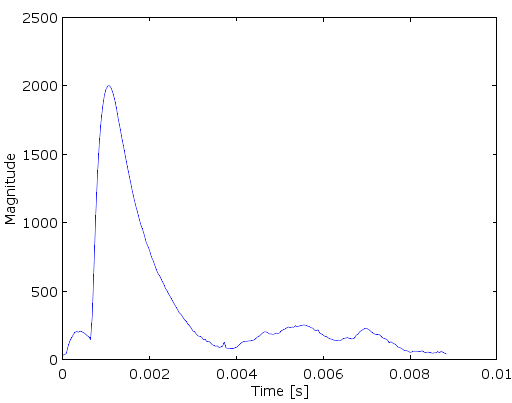
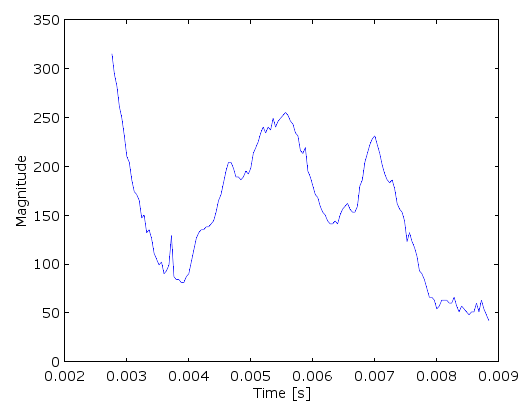
Let's look closer at your data, the second set that was larger. From a plot in the time domain (see below), we see a very large transient at the initial part of your capture that would likely obscure our ability to see the general frequency content, so I chose to work with a subset of your data from 2.8ms to 8.84 ms (which would decrease the frequency resolution further unfortunately but allows us to not be overcome by the initial impulse).

enter image description here

Showing the region after the initial impulse:

enter image description here

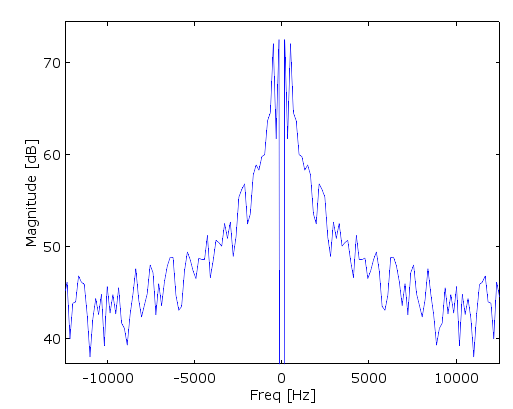
Here is the FFT of that portion of your sequence. I had removed the mean before taking the FFT which is why there appears to be a large null in the center.

enter image description here

The peak is near 500 Hz, with around 170 Hz of resolution.

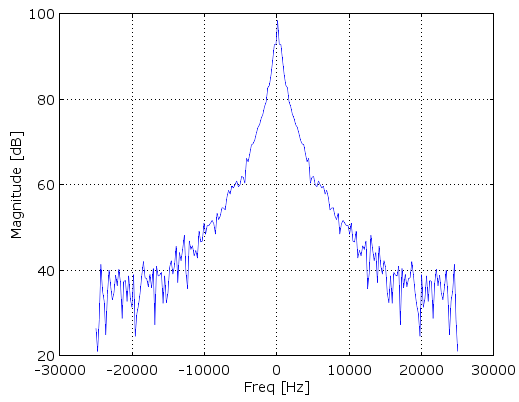
This is what the FFT looks like without removing DC or the initial transient in the beginning. enter image description here

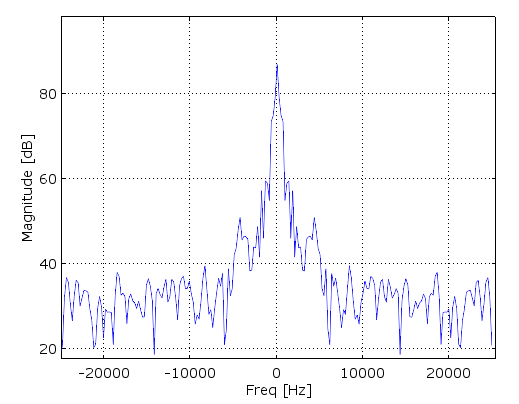
Windowing your data first can help reduce the side-lobes in frequency to give you more dynamic range (if you are looking for lower level signals that may be masked by the side-lobes from larger signals), but know that that will decrease your frequency resolution further.

Here is the same plot as above of your entire second data set after applying a Kaiser window.

enter image description here

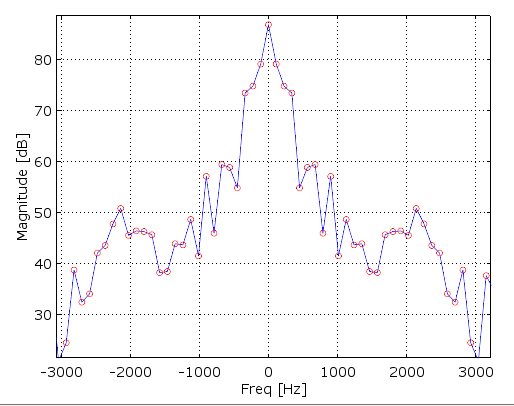
And a zoom in of above showing the FFT bin sample locations:

enter image description here

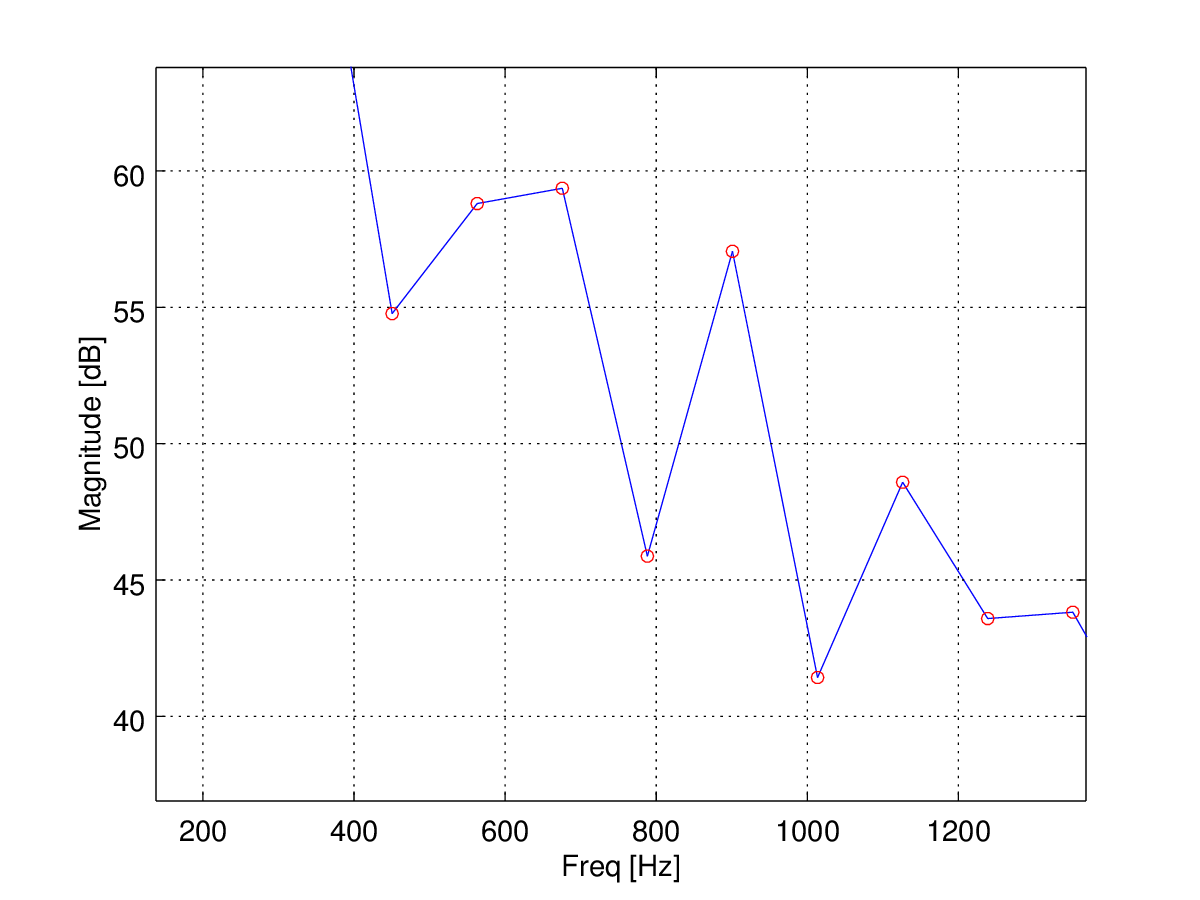
Zooming in further, we see the detail below. The Kaiser window used was with a Beta of 8, which has a frequency resolution that is approximately 3x wider than the non-windowed example. Since I used the complete data set (and the effects of the impulse are masking the lowest frequency region accordingly), the resolution non windowed would be 112.6 Hz, and with the window used around 330 Hz.

enter image description here

My recommendation to get more meaningful results is to increase the time length of your capture (assuming your frequency is stationary for a longer time). Given the frequency roll-off visible from these FFT's, it is not necessary to sample at 25 KHz; so you could reduce your sampling rate if that helps you increase the time length of the capture.

$\endgroup$

Your Answer

By clicking “Post Your Answer”, you agree to our terms of service and acknowledge you have read our privacy policy.

Not the answer you're looking for? Browse other questions tagged or ask your own question.