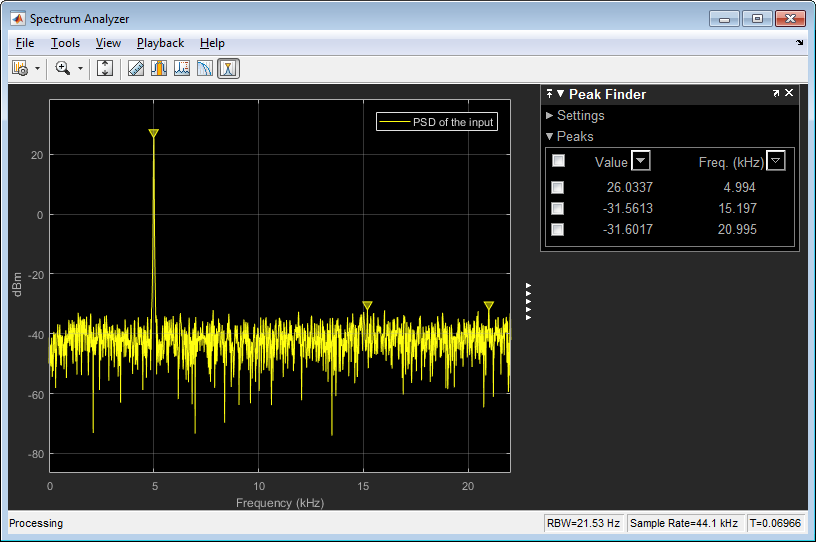
I am testing the output values of dsp.SpectrumAnalyzer for a sine wave mixed with white noise. The $\sigma^2$ of the white noise is 1e-4, so I use 0.01*randn(1024,1) to generate it. The sine wave is generated by dsp.SineWave with default amplitude (=1). The sampling rate is 44100 Hz. If the 'SpectrumType' property of dsp.SpectrumAnalyzer is set by default ('Power'), the scope output is as follows:
 According to the analysis in "Convert the Power in Watts to dBW and dBm" section of Estimate the Power Spectral Density in MATLAB, The peak is at 26.9897 dBm, which is what the above screenshot shows us. But other values in the figure confused me. I will ask them one by one.
(1) The power spectrum of the white noise is $\sigma^2$=1e-4 (right?), which is 10*log10(1e-4/1e-3)=-10dBm according to the definition in the above link. But the figure shows that the power spectrum of the white noise is at -40dBm. How is this value obtained? PS: if we calculate the power spectrum in dBW, 10*log10(1e-4)=-40 which is close to what the figure shows, but here I am using dBm unit!
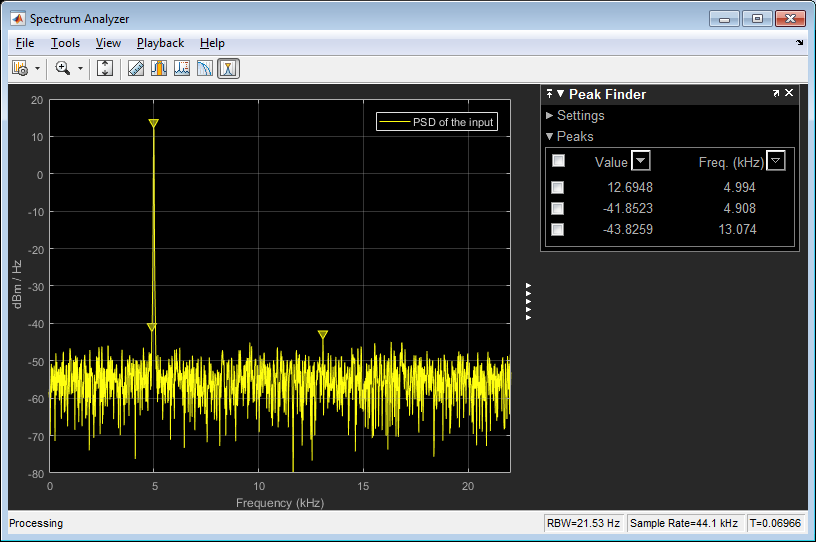
(2) If I change the 'SpectrumType' property of dsp.SpectrumAnalyzer to 'Power density', the output of the System object is as follows:
According to the explanation of this property in documentation dsp.SpectrumAnalyzer System object, now the peak of the sine wave should be "the magnitude squared of the spectrum normalized to a bandwidth of 1 hertz.". The spectrum is 0.5, so its square is 0.25, what I expected to get in dBm should be 10*log10(0.25/1e-3)=23.9794dBm, but what I can see in the figure is 12.6948 dBm. How is this value obtained?
(3) Let's look at the power spectrum density of the white noise again. According to the definition mentioned in the above question, the value should be 10*log10(1e-4^2/1e-3)=-50dBm. I'm not sure if the calculation is correct, but it is close to the figure, although there seems to be some distance. The question is, the section "Convert the Power in Watts to dBW and dBm" of Estimate the Power Spectral Density in MATLAB says the $P_{whitenoise}$=1e-4*(22050/21.53)=0.1024, but if we calculate the dBm, we get 10*log10(0.1024^2/1e-3)=10.2060. To my surprise, the webpage then says "the total power of the white noise is -39.87 dBm." How is this -39.87 dBm obtained?
I'm totally confused about these values. I will greatly appreciate it if you can help me clarify them. Thanks a lot!
The following are some reference code for your experiment. I am using the latest Matlab R2016a.
Fs = 44100;
Sineobject1 = dsp.SineWave('SamplesPerFrame',1024, 'PhaseOffset',10,...
    'SampleRate',Fs,'Frequency',5000);
SA = dsp.SpectrumAnalyzer('SampleRate',Fs,'SpectrumType','Power',...
    'PlotAsTwoSidedSpectrum',false,'Window','Hann',...
    'ChannelNames',{'PSD of the input'},'ShowLegend',true);
for Iter = 1:5
    Sinewave1 = step(Sineobject1);
    Input = Sinewave1;
    NoisyInput = Input + 0.01*randn(1024,1);
    step(SA,NoisyInput);
end

