0
$\begingroup$

My input is x and my filtered output is y. The sampling rate of x is Fs. I create a low-pass Butterworth filter in MATLAB as follows.

[b,a]=butter(order,cutoff*(2/Fs));
y = filter(b,a,x);

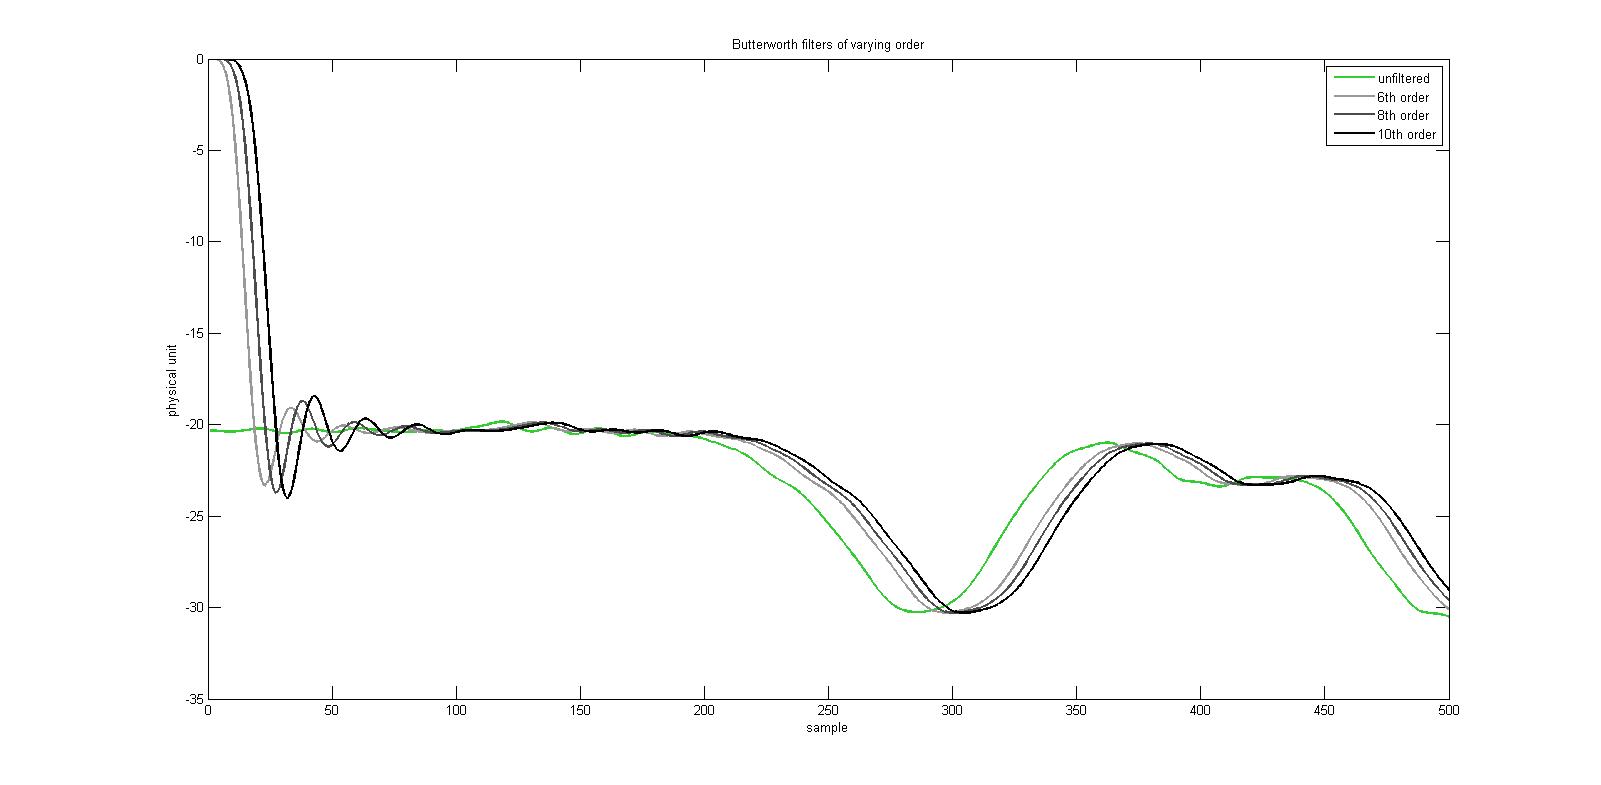
Letting order vary (cutoff fixed at 20Hz) yields these outputs y. varying order
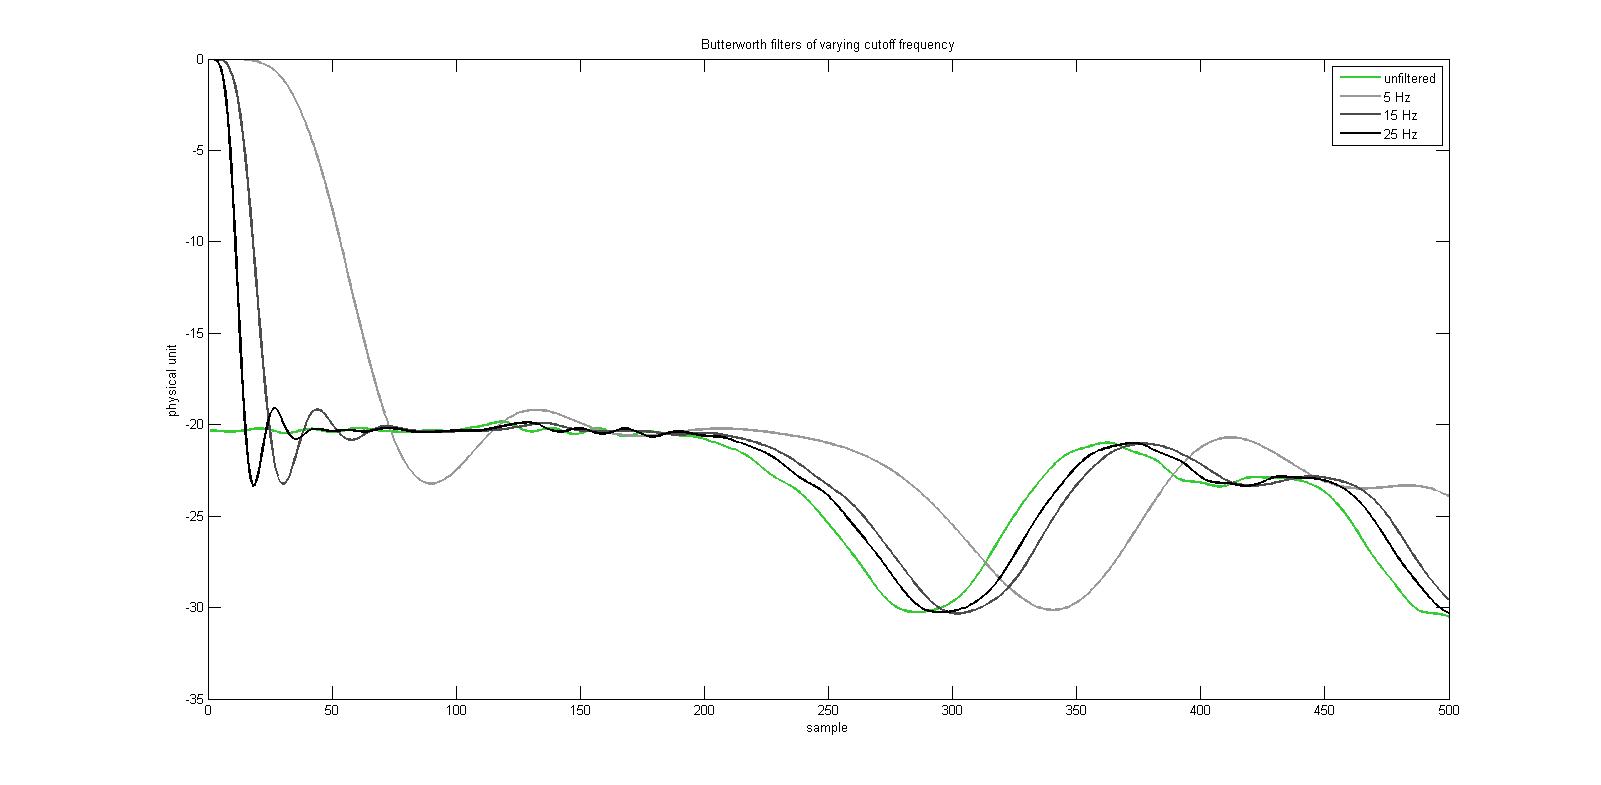
Letting cutoff vary (order fixed at 6) yields these outputs y. varying cutoff frequency
I have a few very rookie questions about this sort of filter.

  • Why does the filter constrain y to equal zero at the first sample?
  • Why is there an initial ripple in y?
  • Why does the time-delay of y increase with order and cutoff?
  • The time step between successive samples of x is 1/Fs. Is the time-step between successive samples of y also 1/Fs?

FYI, my goal in filtering x is to remove high frequency noise above 20 Hz or so.

$\endgroup$
2
  • $\begingroup$ I think you got the text and figures interchanged (first fig. seems to be fixed order, second one fixed cut-off, at least according to the legends). $\endgroup$
    – Matt L.
    Commented Mar 26, 2015 at 14:12
  • $\begingroup$ whoops. Fixed that now. $\endgroup$
    – RNG
    Commented Mar 26, 2015 at 14:24

1 Answer 1

0
$\begingroup$

The filter doesn't constrain the first sample to be zero. The first sample just has a relatively small value, because it takes the filter some time to react to the input signal. This is because initially the delay elements of the filter contain zeros (i.e. the initial state is zero). This means that for the filter it looks like there has been a long input signal consisting only of zeros, and suddenly the input jumps to a value of around $-20$. This is also why you see the ripples in the output signal. What you see is basically the (negative) step response of the filter. And any frequency selective filter with a decent (frequency domain) performance will have some overshoot in its step response.

Note that the function filter() accepts an initial state as an input argument. So you could compute the filter state for a constant input signal (say about 100 samples or more) equal to the first value of the actual input signal. The filter function will give you the final state after having processed that constant input signal, which you can use as initial state for filtering the actual data. This will greatly reduce any transients in the filter output:

[dum,s] = filter(b,a,x(1)*ones(100,1));    % get initial state
y = filter(b,a,x,s);                       % filter with initial state s

The group delay of the filter is frequency dependent, so it's hard to make general statements about the delay of a specific input signal. What is true is that the average group delay increases with increasing filter order.

$\endgroup$

Your Answer

By clicking “Post Your Answer”, you agree to our terms of service and acknowledge you have read our privacy policy.

Not the answer you're looking for? Browse other questions tagged or ask your own question.