I don't unstand the nature of the output in Matlab's "butter" command. Calling
[b,a] = butter(4, 0.5, 'low');
gives me two vectors, which the documentation says are b for numerator, and a for denominator, of the transfer function.
However plotting the frequency response of this transfer function with freqz() does not give me what I expected.
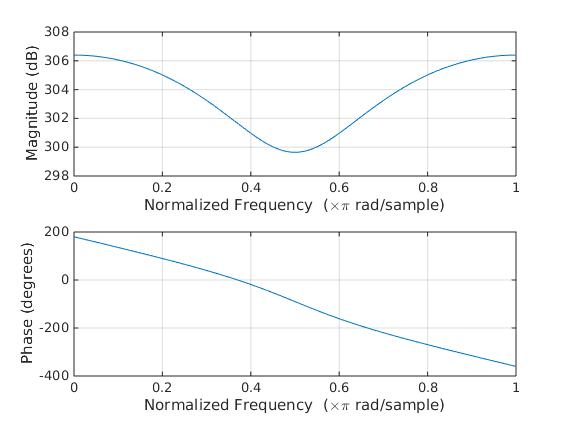
If I plot
freqz(b./a)
I see:

This is not a low pass filter, this is some sort of band stop filter suppressing the middle frequencies. However if I plot
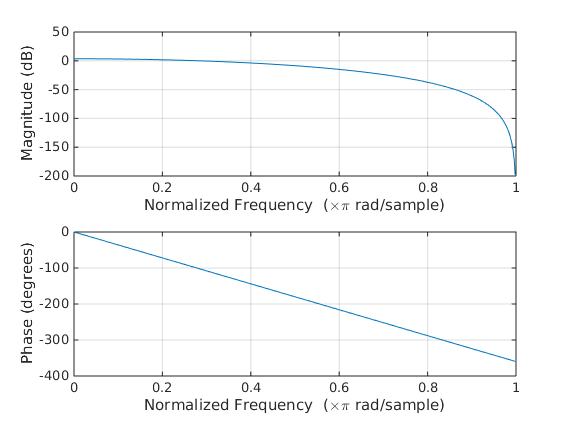
freqz(b)
I see what looks like the low pass filter I was hoping for:

So if I want to use a Butterworth filter to low pass my data, do I only use b? And if so what is the point of a?
