1
$\begingroup$

Hi guys I have a really tough signal processing question here.

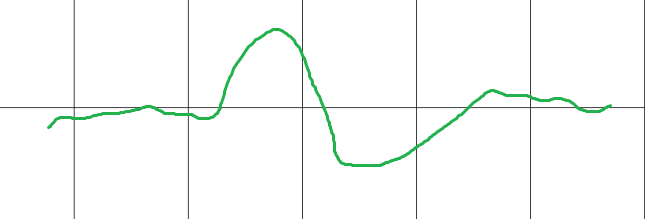
How do you detect and distinguish two very very similar looking waves?

I need to distinguish between these two signals for an online application and the techniques so far have all failed. These two signals have very similar and often unpredictable amplitudes. Almost identical frequency. So the only way I can attempt to distinguish between the two is using time domain features.

Signal 1: enter image description here
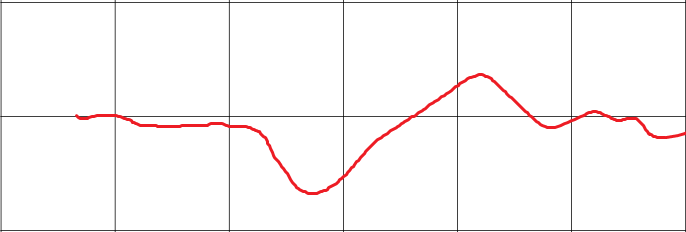
Signal 2: enter image description here

The data is streamed live in every single second (at 128 samples per second). My approach is to:

  1. use a window of size 128 samples to obtain the data

  2. Calculate the time domain features of the data features such as:

    • derivative between the mean of the current 128 samples and previous 128 samples,

    • derivative between the max point of the current 128 samples and previous 128 samples

    • skewness of the data

    • kurtosis of the data

    • deviation from the mean

  3. If derivative goes down, then we say it is signal 1 and if derivative does down we say it is signal 2

But the problem is that the two signals look very very similar. So if the window is incorrectly placed (i.e. on the rising or falling phase after the initial signal), then it can give me the complete opposite result!

Can someone give me some suggestions as to what features I should use or what technique I should use to distinguish between this two very similar looking signals!

$\endgroup$
2
  • 3
    $\begingroup$ Why cant you use a correlator of some kind? $\endgroup$ Commented Feb 1, 2015 at 9:32
  • $\begingroup$ The answer depends a lot on some information that you have not yet provided. For instance, is the polarity fixed like in your example? Also, did you draw those by hand? If yes, how do the signals really look? Next, what kind of other signals are to be expected on the channel? What is the signal to noise ratio? What latency do you allow for the detection? What is the time scale of the features? What is the tolerance for false negative? False positives? $\endgroup$
    – Jazzmaniac
    Commented Feb 4, 2015 at 18:51

3 Answers 3

4
+50
$\begingroup$

As Conrad pointed out, a correlator is probably your best bet.

The correlation of a signal with itself (also known as its self-similarity) is larger than its correlation with any other signal (except for a constant factor related to the signals' energy).

In your case, you would implement two correlators, one for Signal 1 and one for Signal 2. Then, you'd look for one of the correlators' output to be larger than a certain threshold. You may have to run a few tests to determine the threshold.

One nice benefit of using correlation is that you don't need to synchronize your time window to the signals. Just be sure to accumulate the correlation calculations from one time window to the next.

$\endgroup$
1
  • $\begingroup$ Will try using self correlation $\endgroup$
    – Fraïssé
    Commented Feb 6, 2015 at 4:34
0
$\begingroup$

Very non-scientific answer that has sometimes worked well for me.

  1. Stare at the data and check whether you (as a human) can reliably distinguish the two
  2. Write down on a piece of paper how you actually do this (e.g. first bump is up on A but down on B).
  3. Code this up as a heuristic algorithm.

Off course, it makes sense to dig in the bag of standard algorithms to help with this (correlation, smoothing, peak detectors, etc.). A nice side benefit of the method is that it's typically easy to debug and tune since you are just trying to copy an algorithm that's already in your head.

$\endgroup$
1
  • $\begingroup$ This is absolutely non-related question. Is there a reason why you won't merge your current account with (presumably) old one? $\endgroup$
    – jojeck
    Commented Feb 19, 2015 at 15:53
0
$\begingroup$

To compare two signals you can use wavelet cross correlation and also wavelet coherence and wavelet phase analyses. In the first case you compare the cross correlation of the signal at different frequencies. In wavelet phase analysis you see which and if a signal anticipates another across time. (Is the cause of the other signal behaviour). You can also use wavelet coherence analysis.

$\endgroup$
2
  • $\begingroup$ Sounds like using the wrong tool. Correlation (just garden variety) is a better, simpler approach. $\endgroup$
    – Peter K.
    Commented Feb 4, 2015 at 15:19
  • $\begingroup$ Maybe but though of Wavelet cross correlation which is the standard for signal processing comparison of two signals $\endgroup$
    – Barnaby
    Commented Feb 4, 2015 at 16:10

Your Answer

By clicking “Post Your Answer”, you agree to our terms of service and acknowledge you have read our privacy policy.

Not the answer you're looking for? Browse other questions tagged or ask your own question.