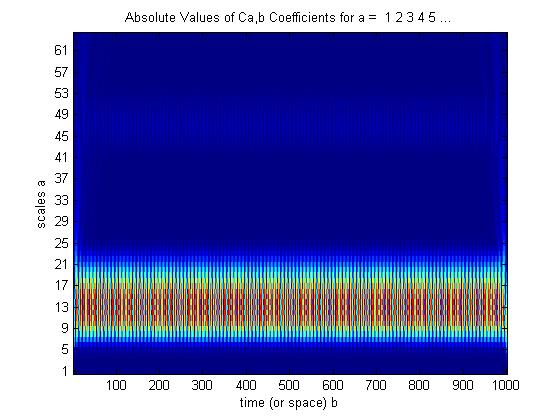
I am new in DSP.I have the flowing code
t = linspace(0,1,1000);
x = cos(2*pi*60*t);
CWTcoeffs = cwt(x,1:64,'sym8','plot');
colormap jet;
and my output is:
their have scale in y axis but i represent in frequency what is the solution in matlab
I think you should try MATLAB's scal2frq. You provide the vector of scales, wavelet name and optionally sampling period. This will return vector of pseudo frequencies.
In your case that should be something like:
f = scal2frq(1:64, 'sym8', t(1)-t(0));