I am currently working on a frequency domain real-time application on a digital signal processor. Currently for one time frame of my algorithm I read in time domain data into a buffer, perform a Fourier transform with a Hanning window (win), which I generate using MATLAB with the following code:
win = 2*hanning(N,'periodic')/N;
where N is my transform length, (usually 2048 in my case). The window coefficients are then stored in a header file as single floating point data to be included into a C project.
In the frequency domain I execute my algorithm, then convert it back to the time domain to be outputted in a third buffer. I am certain the forward and reverse transforms work correctly having thoroughly tested them (and having used them for several months).
However when I output the data I use the following 'window' to reverse the effects (i.e. the energy level of the time domain signal to remove the 'oscillating' effect of the reconstructed signal) of the original window that I applied (in MATLAB code):
win_out = win ./ (win.^2);
I've seen the divide by energy (win.^2) in other peoples code, and assume that the line of MATLAB code above is equivalent to (it gives the same result of course):
win_out = 1./ win;
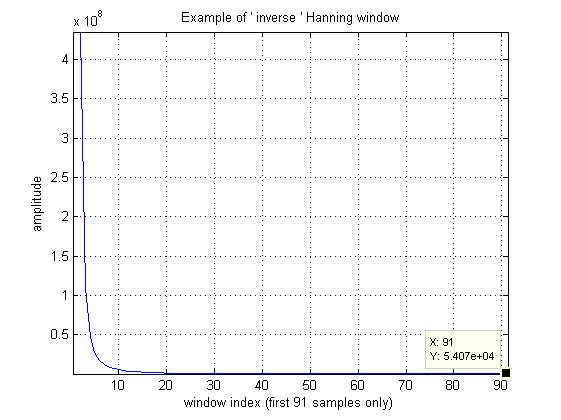
When I implement this in my real time application the values on the edge of my 'output' window (win_out) are very large (of the factor x10^8, see image below) and are in fact too big. This results in the edges of my time period being amplified too much resulting in a 'clippy' effect in my time domain signal when I listen to it.
I've illustrated the problem below

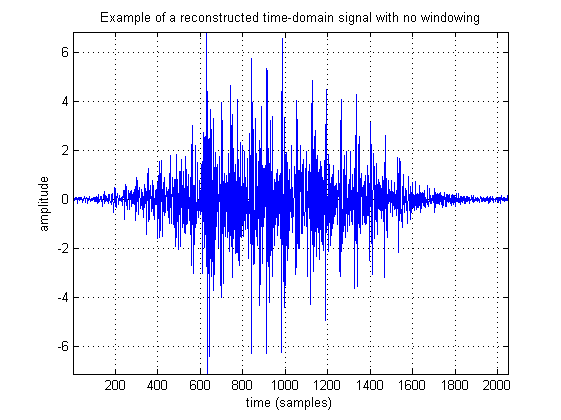
Above is the original reconstructed time domain signal, if this was to be outputted it would have an oscillating effect on the output, which I try and fix by applying an 'inverse' window.

This is the inverse window that generated by the above MATLAB code.

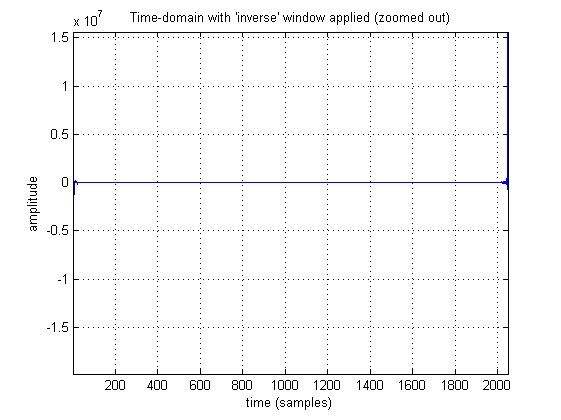
Time domain signal with my 'inverse' window (note: spikes at each end).

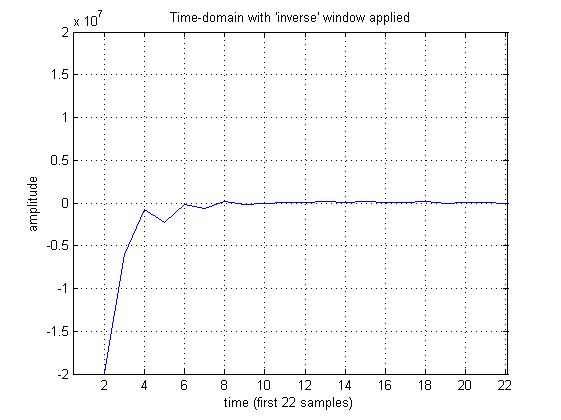
First spike zoomed in.
NB: I don't use overlapping (yet!)
My question is: how do a choose an 'inverse' (if that is the correct term?) window to ensure those spikes aren't present in fully reconstructed time domain signal with window?
Many thanks !
