First thing to mention is that you must have some kind of Machine Learning algorithm to perform your recognition. You might want to use the following - what's yours?
- Neural Networks (easy to implement)
- SVM's (should perform best)
- k-NN (eventually, but needs lot's of data to store)
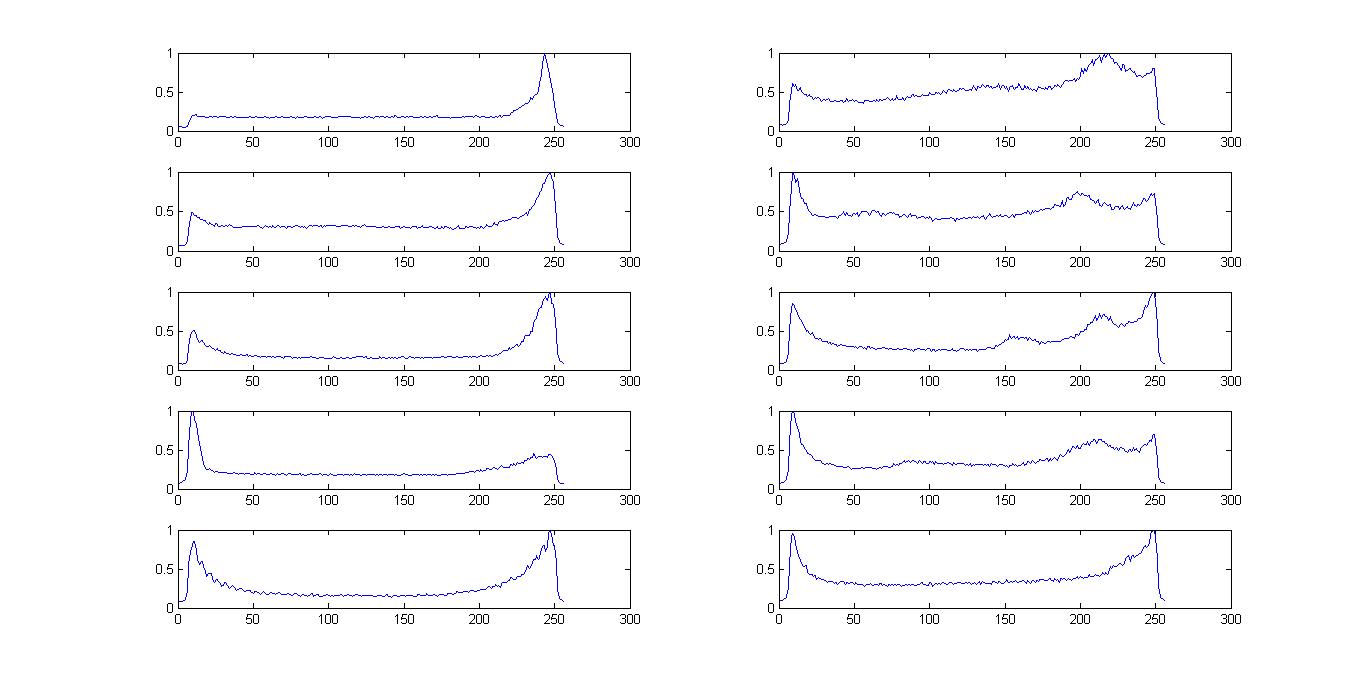
Regarding features, it's hard to determine which to use for your application just by looking at spectra - both of categories have peaks at lower and higher part of range. Also there might be some significant information in time domain or a specific method valid for processing this type of signals. You never said what these signals are and what's the application.
The only thing I notice is that class 2 has some harmonic content occurring at frequencies $160 \mathtt{Hz}$, and $200 - 225 \mathtt{Hz}$. I don't think that simple mean and variance will do. Probably you should try different and choose best performing ones. My suggestions of features you've asked for (to start with), are:
- Spectral Slope (what's the gradient of the linear regression of your spectrum)
- Audio Spectrum Flatness (calculated in frequency banks - tells you if signal is noisy or harmonic)
- Audio Spectrum Centroid (kind of 'mean value' you mentioned)
- Audio Spectrum Envelope (can be understood as very general spectrum descriptor - envelope)
- MFCC (well defined and described - they are describing your spectrum by using cepstral analysis)
For more info about implementations you can refer to this great book (easy to get): MPEG-7 Audio and Beyond.

