5
$\begingroup$

I have two signals sampled at $100\textrm{ Hz}$ during $3\textrm{ seconds}$. So I have $300$ sample points at each signal series. I want to calculate coherence values between these two time series and would like to know whether this coherence value is statistically significant. I found two resources online.

  • In the first resource, there is a parameter $n$ (it is the sample size as I could interpret). A significant coherence value for that $n$ is: $$c = \sqrt{1-\alpha^{1/(n-1)}}$$

    and this formula does not include any frequency component, unless $n$ is related to frequency instead of sample size.

  • In the second resource, the function returns degree of freedom and significance level at each frequency. However I am not sure whether this function returns the correct computation or not. Besides I couldn't interpret the results of this function.

My question: How can I find the significance of my computed coherence value at a certain frequency (or frequency band) preferably using MATLAB in the light of the above resources?

$\endgroup$

3 Answers 3

3
$\begingroup$

Great question! I've been grappling to determine how to calculate statistical significance of coherence for several days. This question helped me find some key references I hadn't previously located!

One detail regards whether you're talking about "coherence" or "magnitude-squared coherence". The first resource uses the former and the second uses the latter. I generally prefer the latter:

$$C_{x,y}(\omega)= \frac{|\langle{X^*(\omega)Y(\omega)}\rangle|^2}{\langle|X(\omega)|\rangle^2\langle|Y(\omega)|\rangle^2}$$

Where $X(\omega)$ is the fourier transform of $x(t)$, and $\langle \rangle$ denotes an ensemble average of $n$ independent ensembles. Obviously the plain "coherence" is the square root of what is defined above.

The significance level of this magnitude-squared coherence as defined by the two resources is:

$$L_1(\alpha, q) = 1-\alpha^{1/q}$$ $$L_2(\alpha, q) = F_{2,2q}(\alpha)/(F_{2,2q}(\alpha)+q) $$

Where $\mathrm{DOF} = 2n = 2 ( q + 1 )$, and $F$ is the inverse-CDF (percent point function) of the F-statistic. Also, just FYI, the second formulation can also be found in Priestley 1981 page 706.

The following Python code implements the two approaches for $\alpha=0.05$ (i.e. a 95% significance level):

import numpy as np
import scipy.stats as st

alpha = 0.05
p = 1 - alpha

dof = np.arange(5, 100)
n = dof / 2.

C_1 = 1 - alpha ** (1. / (n - 1))

fval = st.f.ppf(p, 2, dof - 2)
C_2 = fval / (n - 1. + fval)

Plotting the two functions shows that they are apparently identical:

import matplotlib.pyplot as plt
ax = plt.gca()

ax.plot(dof, C_1, 'k-', lw=10, label=r'$1-\alpha^{1/q}$')
ax.plot(dof, C_2, 'r-', lw=5, label=r'$F_{2,2q}(\alpha)/(F_{2,2q}(\alpha)+q)$')
ax.plot(dof, 6. / dof, 'b-', lw=2, label=r'$6/d$')

ax.set_xlabel('Degrees of Freedom')
ax.set_ylabel('{:0.0f}% Significance Level'.format(100 * p))
ax.legend()
ax.set_title(r"Coherence level for $\alpha=0.05$")
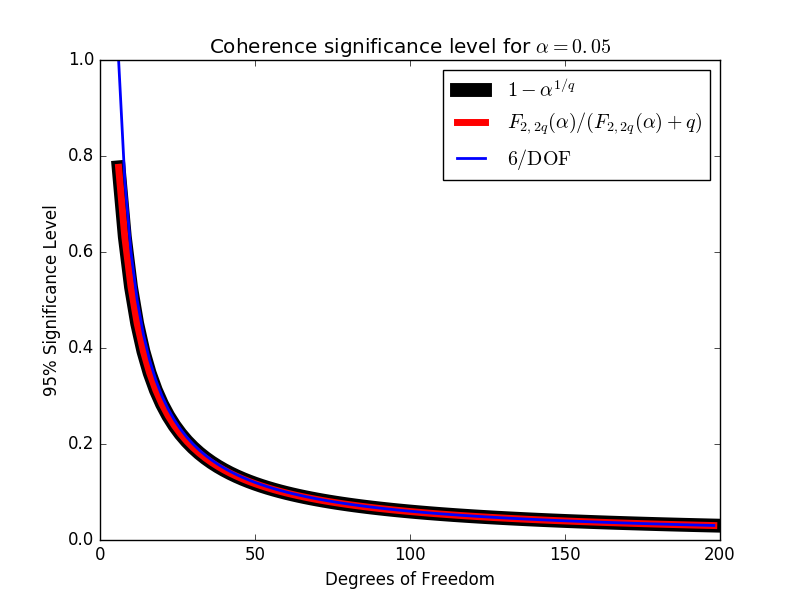
Coherence significance level for alpha = 0.05.

I compared $L_1$ (black) and $L_2$ (red) for several different values of $\alpha$ and they always agree (their difference was always $O(10^{-16})$). I didn't bother doing the algebra to show that $L_1=L_2=L$, but perhaps someone else will find that to be an interesting undertaking?

Lastly, I've included the approximation: $L(\alpha=0.05)\approx6/\mathrm{DOF}$ (blue). I got this from U. Washington Applied Physics Lab professor Jim Thomson, which he apparently got from legendary oceanographer Carl Wunsch. It appears to be a very good approximation when $\alpha=0.05$ and $\mathrm{DOF} > 20$ or so. I'd be interested to see the algebra that shows that:

$$\lim_{\mathrm{q}\rightarrow\infty}L(1/20,q) = \frac{6}{\mathrm{DOF}}$$

$\endgroup$
1
  • 1
    $\begingroup$ I am not sure I understood your answer correctly.Does that mean that, for example, with 200 sampling points, anything above 0.05 is considered as statistically relevant ? I plotted the coherence of two unrelated white noise process for 1000 point and this is what i get : ![enter image description here](i.sstatic.net/QiGsR.png) There is clearly no relation whatsoever between my two times series, apart from the fact that they are drawn from the same distribution, yet I get quite high values... $\endgroup$
    – Johncowk
    Commented May 28, 2019 at 9:08
1
$\begingroup$

For both of the resources you pointed to, what they mean by "significance level" is the coherence value that would happen $(1-\alpha)$% of the time if the true coherence were zero. The $n$ in those expressions is the number of degrees of freedom (2$\times$ the number of bands averaged or the number of records used to estimate the coherence).

The theoretical formula really works! You can see this by taking any time series of your choice and computing the coherence against a vector of random numbers. If you do that 1000 times and see compute the mean coherence value that you found, it will be very close to the value given by the formula. In fact, this kind of Monte Carlo significance estimate is another fine way to estimate the significance level.

P.S.: the link to the first resource no longer works, but I think it was pointing to this paper by R.O.R.Y Thompson ("Coherence Significance Levels"), https://journals.ametsoc.org/view/journals/atsc/36/10/1520-0469_1979_036_2020_csl_2_0_co_2.xml?tab_body=fulltext-display

$\endgroup$
0
$\begingroup$

In the first resource, there is a parameter n (it is the sample size as I could interpret).

No, n is the averaging being done - either n separate pairs of spectra are being averaged, or the averaging is being done across n adjacent frequency bins. As long as the averaging is independent of the frequency, the coherence limit is independent of the frequency as well. Of course, the larger the sample size, the more averaging you can usefully do, but the limit c is formally independent of the sample size (the number of points being FFTed) as well.

$\endgroup$

Your Answer

By clicking “Post Your Answer”, you agree to our terms of service and acknowledge you have read our privacy policy.

Not the answer you're looking for? Browse other questions tagged or ask your own question.