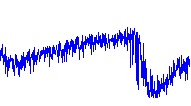
I sample a continuous signal $s(T)$ over time. This leads to $s[t]$, which depends on several factors of which some are (pseudo-) periodic. I am interested in the effect of one such periodic factors and want to look at signal changes during this period under differing experimental conditions. I know the start and end of every period $i$ and said period slowly and slightly varies over time.
Raw signal $s[t]$

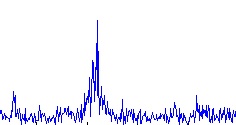
My first approach was to estimate the size of the periodic changes by looking at the power spectrum, where under certain conditions the largest peak is indeed around the frequency for the mean period which I know a priori.
Power spectrum $S[\omega]$

For each measurement I know the start and the end time of the current period $i$, say $t_{i,start}$ and $t_{i,end}$. If I calculate the "phase" or relative position in the current period $\varphi(t)=\frac{t-t_{i,start}}{t_{i,start}-t_{i,end}}$ I can reorder my data as such and plot it. Because I have many samples and the frequency of the effect is not correlated to my sampling frequency the phase increase in my reordered data averages out to pretty much linear (so the two images below are almost identical).
Reordered raw data for reordered sample number $s[n]$

Data plotted to phase $s[\varphi]$

Looking around with google I found that this is called Equivalent-Time Sampling (ETS) in some fields. However it is difficult to find a mathematical formulation for this operation, so it is difficult to see really what information I keep and lose from my data.
My question now is broad: is there a formal mathematical way to model ETS (maybe as a filter on a transformed domain?) and how can I make valid observations about the size and qualities (for example waveform) for this effect when using ETS?
Above (when calculating $\varphi$) I implicitly asume that the waveform is stretched if a period is longer, but in reality there might just be a longer delay before a certain impulse is processed again. Might it be better to use an absolute time delay since start of current period? (as $\varphi(t)=t-t_{i,start}$)
Update
So I think the data, once in equivalent time, can also be considered as unevenly spaced timeseries, since $\varphi(t)$ is unevenly spaced due to the differing period lengths. An answer here suggests methods to calculate correlation between unevenly spaced timeseries. With those methods it might be possible to make a comparison between measurements without any filtering and without assuming a certain sampling rate (seems artificially high in the reordered data). Another answer (and this related answer) suggests to use a Kalman filter to smooth the unevenly spaced time series.
