13
$\begingroup$

Please suppose the following:

  • The frequency of a signal's fundamental has been estimated using FFT and some frequency estimation methods and is lying between two bin centers
  • The sampling frequency is fixed
  • Computational effort is not an issue

Knowing the frequency, what is the most accurate way to estimate the corresponding peak value of the signals fundamental?

One way might be to zero-pad the time signal to increase FFT resolution such that the bin center will be closer to the estimated frequency. In this scenario, one point I am not sure about is if I can zero-pad as much as I want or if there are some drawbacks in doing so. Another one is which bin center I should select after zero padding as the one I am obtaining the peak value from (because one may not hit the frequency of interest exactly, even after zero padding).

However, I am also wondering whether there is another method which may deliver better results, f.e. an estimator which uses the peak values of the surrounding two bin centers to estimate the peak value at the frequency of interest.

$\endgroup$
4
  • 2
    $\begingroup$ zero padding before FFT is one way. Another one is to apply a window function that is suited for your neads. The flat top window was designed for exactly this purpose. Of course, if you already know the frequency exactly and you're interested in just one amplutide, there are probably cheaper ways to do it than an FFT. $\endgroup$
    – sellibitze
    Commented Nov 13, 2013 at 13:22
  • 1
    $\begingroup$ no zero padding required : simple parabolic interpolation (with 3 points : imax-1, imax, imax+1, where imax is the FFT peak) will give you accurate results $\endgroup$
    – Basj
    Commented Nov 13, 2013 at 23:13
  • $\begingroup$ Make sure the interpolation function matches the window function. Flat-top is trivial, otherwise you want a matching pair (e.g. rectangular window + sinc interpolation, gaussian window + gaussian interpolation etc.) $\endgroup$
    – finnw
    Commented Nov 15, 2013 at 20:52
  • $\begingroup$ @CedronDawg this question and its answers are related (but not the same) with your exact frequency formula. May be you can find it interesting. $\endgroup$
    – Fat32
    Commented Nov 16, 2018 at 21:33

7 Answers 7

6
$\begingroup$

The first algorithm that springs to mind is the Goertzel Algorithm. That algorithm usually assumes that the frequency of interest is an integer multiple of the fundamental frequency. However, this paper applies the (generalized) algorithm to the case you are interested in.


Another problem is that the signal model is incorrect. It uses 2*%pi*(1:siglen)*(Fc/siglen). It should use 2*%pi*(0:siglen-1)*(Fc/siglen) for the phase to come out correctly.

I also think there is a problem with the frequency Fc=21.3 being very low. Low-frequency real-valued signals tend to exhibit bias when it comes to phase/frequency estimation problems.

I also tried a coarse grid search for the phase estimate, and it gives the same answer as the Goertzel algorithm.

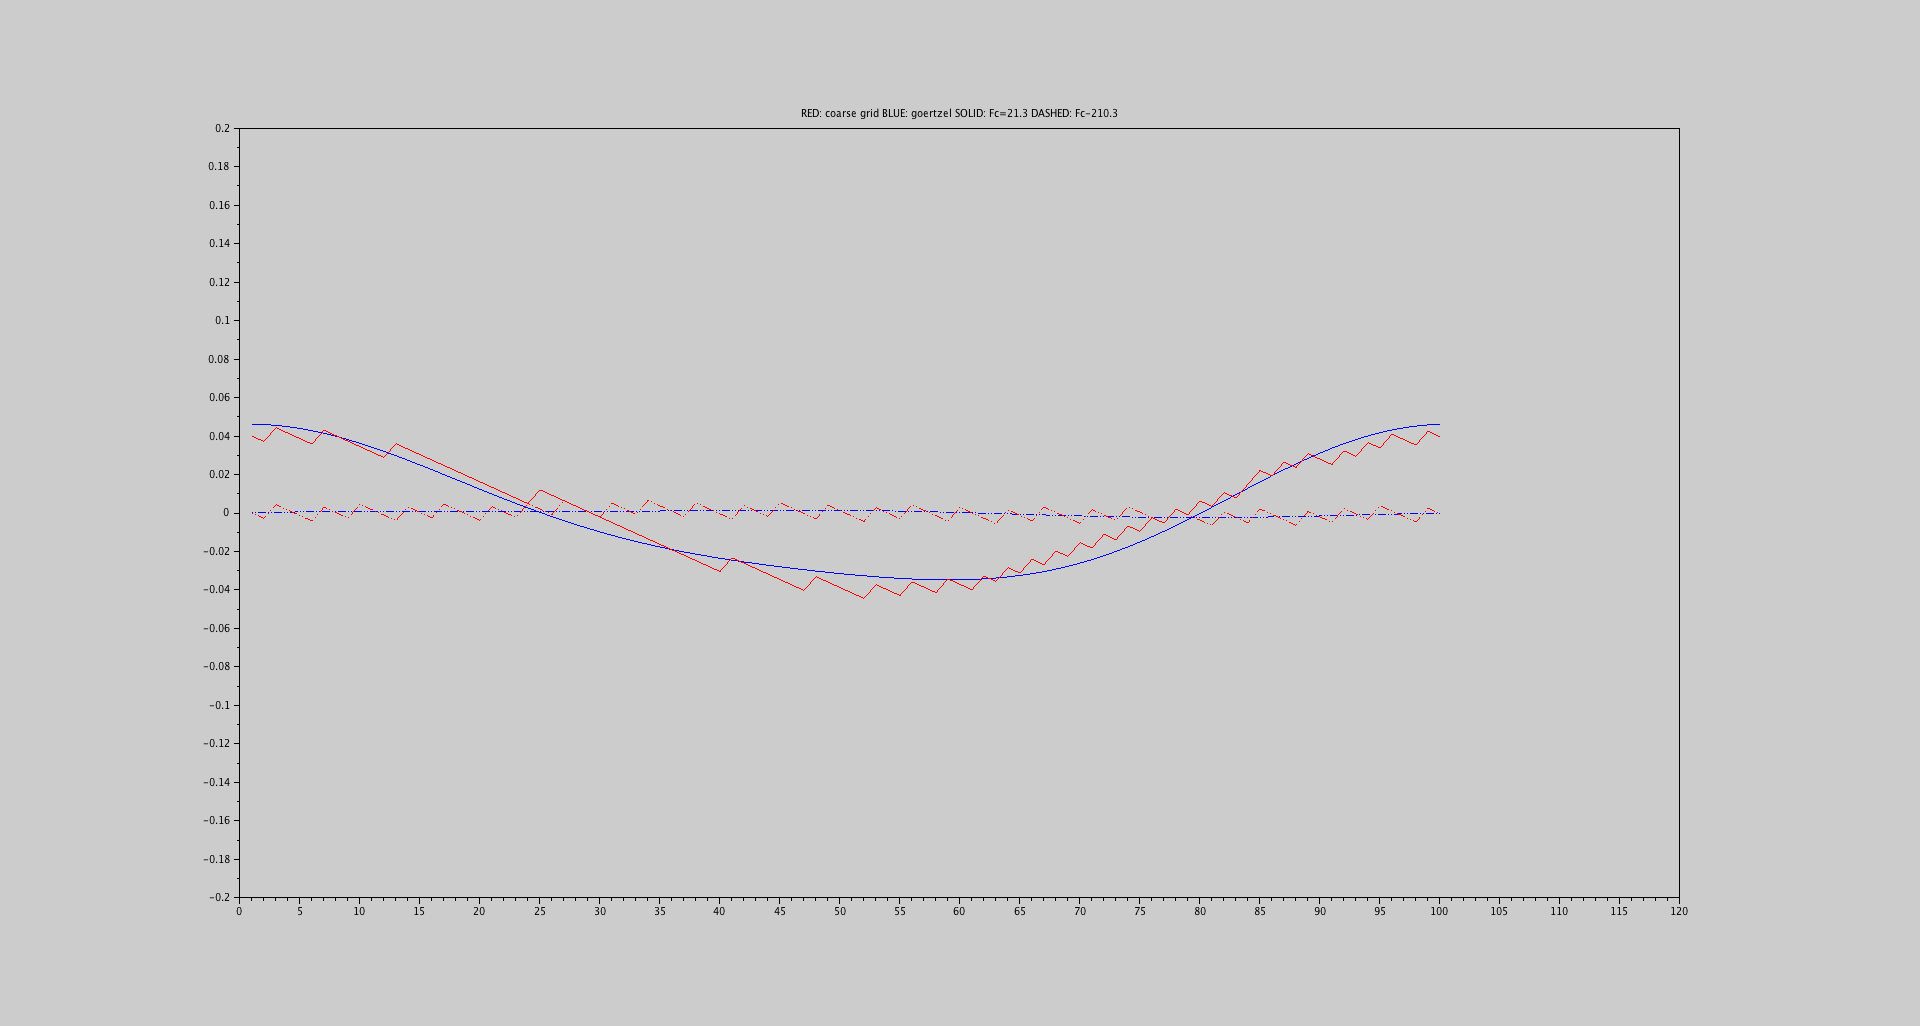
Below is a plot that shows the bias in both estimates (Goertzel:blue, Coarse:red) for two different frequencies: Fc=21.3 (solid) and Fc=210.3 (dashed). As you can see the bias for the higher frequency is much less.

The plot $x$-axis is the initial phase changing from 0 to $2\pi$.

enter image description here

$\endgroup$
9
  • $\begingroup$ Just tested the code for the Goerzel algorithm based on the paper. Using the output DTFT value, the peak can be obtained very accurately. However, there is a scaling factor of exactly 1000. So, if the original peak is 1,234, after Goerzel it will be 1234. Does anybody know where this could come from? $\endgroup$
    – lR8n6i
    Commented Nov 10, 2013 at 11:12
  • $\begingroup$ Did some research in the meantime. Probably it has to do with the amplitude scaling: scaling time domain amplitude = frequency domain coefficient * 2 / N, where N is the length of the signal. Is this assumption right? $\endgroup$
    – lR8n6i
    Commented Nov 10, 2013 at 12:34
  • 1
    $\begingroup$ Yes, that's usually the case: the length of the signal usually comes in as a scale somewhere along the line. $\endgroup$
    – Peter K.
    Commented Nov 10, 2013 at 18:49
  • $\begingroup$ Hi! I just found out that using Goertzel algorithm, the amplitude at the resulting complex coefficient is very accurate, but the phase is completely wrong. Does someone has an idea where this could come from? By "phase" I mean the phase lag specified in the fundamental of the original signal. $\endgroup$
    – lR8n6i
    Commented Nov 12, 2013 at 16:57
  • 1
    $\begingroup$ @Rickson1982 The phase is correct. You're just not interpreting it correctly. :-) Remember: $\sin(\omega_0 t + \phi) \leftrightarrow \frac{j}{2} [ e^{-j\phi}\tilde{\delta}(\omega+\omega_0+2\pi k) - e^{+j\phi}\tilde{\delta}(\omega-\omega_0+2\pi k)]$ i.e. it's out by $\pi/2$ (90 degrees) from what you're expecting. $\endgroup$
    – Peter K.
    Commented Nov 13, 2013 at 1:39
4
$\begingroup$

If you are willing to use multiple neighboring FFT bins, not just 2, then windowed Sinc interpolation between the complex bin results can produce a very accurate estimate, depending on the width of the window.

Windowed Sinc interpolation is commonly found in high quality audio upsamplers, so papers on that subject will have suitable interpolation formulas with error analysis.

$\endgroup$
1
  • $\begingroup$ Thanks for the comment. I will give this approach a try, too. $\endgroup$
    – lR8n6i
    Commented Nov 10, 2013 at 10:52
4
$\begingroup$

If you use Flanagan [1] it is computed from the phase difference of successive phase spectra Δϕ (Instantaneous Frequency) and if you reconstruct the magnitude using a correct factor (Instantaneous Magnitude) [2] use a normalized sinc function: $$ \frac{\sin( \pi x ) }{ (\pi x)}$$ And at the end use Parabolic interpolation around the peak magnitude you can get amazing results, today I consider it is the best way, I have been used it and the results are always very solid :-)

[1] J. L. Flanagan and R. M. Golden, “Phase vocoder,” Bell Systems Technical Journal, vol. 45, pp. 1493–1509, 1966.

[2] K. Dressler, “Sinusoidal extraction using an efficient implementation of a multi-resolution FFT,” in Proc. 9th Int. Conf. on Digital Audio Effects (DAFx-06), Montreal, Canada, Sep. 2006, pp. 247–252.

$\endgroup$
1
  • $\begingroup$ Hi! Thanks a lot for all your comments. I extended my code (see below) to combine Goertzel filter with parabolic peak interpolation to get the phase. However, the results are still not accurate (+- 3-4deg). Is this as close as it gets or are there mistakes in understanding or coding? $\endgroup$
    – lR8n6i
    Commented Nov 14, 2013 at 21:46
3
$\begingroup$

One method is to find the maximum and fit a parabola about it, and then use the parabola's maximum as the frequency and magnitude estimate. You can read all about here: https://ccrma.stanford.edu/~jos/sasp/Sinusoidal_Peak_Interpolation.html

$\endgroup$
3
$\begingroup$

I had a lot of difficulty with this exact problem a couple of years ago.

I posted this question:

https://stackoverflow.com/questions/4633203/extracting-precise-frequencies-from-fft-bins-using-phase-change-between-frames

I ended up doing the calculations from scratch, and posted an answer to my own question.

I'm surprised that I was not able to find any similar exposition on the Internet.

I will post the answer again here; note that the code is designed for a scenario in which I am overlapping my FFT window by 4x.

π


This puzzle takes two keys to unlock it.

Graph 3.3:

enter image description here

Graph 3.4:

enter image description here

Code:

for (int k = 0; k <= fftFrameSize/2; k++) 
{
    // compute magnitude and phase 
    bins[k].mag = 2.*sqrt(fftBins[k].real*fftBins[k].real + fftBins[k].imag*fftBins[k].imag);
    bins[k].phase = atan2(fftBins[k].imag, fftBins[k].real);

    // Compute phase difference Δϕ fo bin[k]
    double deltaPhase;
    {
        double measuredPhaseDiff = bins[k].phase - gLastPhase[k];
        gLastPhase[k] = bins[k].phase;

        // Subtract expected phase difference <-- FIRST KEY
        // Think of a single wave in a 1024 float frame, with osamp = 4
        //   if the first sample catches it at phase = 0, the next will 
        //   catch it at pi/2 ie 1/4 * 2pi
        double binPhaseExpectedDiscrepancy = M_TWOPI * (double)k / (double)osamp;
        deltaPhase = measuredPhaseDiff - binPhaseExpectedDiscrepancy;

        // Wrap delta phase into [-Pi, Pi) interval 
        deltaPhase -= M_TWOPI * floor(deltaPhase / M_TWOPI + .5);
    }

    // say sampleRate = 40K samps/sec, fftFrameSize = 1024 samps in FFT giving bin[0] thru bin[512]
    // then bin[1] holds one whole wave in the frame, ie 44 waves in 1s ie 44Hz ie sampleRate / fftFrameSize
    double bin1Freq = (double)sampleRate / (double)fftFrameSize;
    bins[k].idealFreq = (double)k * bin1Freq;

    // Consider Δϕ for bin[k] between hops.
    // write as 2π / m.
    // so after m hops, Δϕ = 2π, ie 1 extra cycle has occurred   <-- SECOND KEY
    double m = M_TWOPI / deltaPhase;

    // so, m hops should have bin[k].idealFreq * t_mHops cycles.  plus this extra 1.
    // 
    // bin[k].idealFreq * t_mHops + 1 cycles in t_mHops seconds 
    //   => bins[k].actualFreq = bin[k].idealFreq + 1 / t_mHops
    double tFrame = fftFrameSize / sampleRate;
    double tHop = tFrame / osamp;
    double t_mHops = m * tHop;

    bins[k].freq = bins[k].idealFreq + 1. / t_mHops;
}
$\endgroup$
1
  • $\begingroup$ You are interpolating the frequency, whereas the OP knows the frequency & wants to interpolate the amplititude. $\endgroup$
    – finnw
    Commented Nov 15, 2013 at 20:47
2
$\begingroup$

This python code will give you a very accurate result (I used it for lots of musical notes and obtained errors less than 0,01% of semitone) with parabolic interpolation (method successfuly used by McAulay Quatieri, Serra, etc. in harmonic+residual separation techniques)

import matplotlib.pyplot as plt
import numpy as np
from scipy.io.wavfile import read
from scipy.fftpack import fft, ifft
import math

(fs, x) = read('test.wav')
if (len(x.shape) == 2):    # if stereo we keep left channel only
 x = x[:,1]

n=x.size
freq = np.arange(n)*1.0/n*fs 
xfft = abs(fft(x))

imax=np.argmax(xfft)  
p=1.0/2*(xfft[imax-1]/xfft[imax]-xfft[imax+1]/xfft[imax])/(xfft[imax-1]/xfft[imax]-2+xfft[imax+1]/xfft[imax])   # parabolic interpolation 
print 'Frequence detectee avec interpolation parabolique :',(imax+p)*1.0/n*fs, 'Hz'
$\endgroup$
1
$\begingroup$
clear all
clc

for phase_orig = 0:pi/18:pi,

%% Specify and generate signal
Amp = 1;                     % Amplitude of signal
Fs = 8000;                   % samples per second
dt = 1/Fs;                   % seconds per sample
Fc = 21.3;                   % Hz
StopTime = 0.25;             % seconds
t = (0:dt:StopTime-dt)';     % seconds

siglen = length(t);
sig = Amp * 1.5 * sin(2*pi*(0:siglen-1)*(Fc/siglen) + phase_orig) + 1.5 * Amp * sin(2*pi*(0:siglen-1)*(Fc/siglen) * 3) ...
  + 1.5 * Amp * sin(2*pi*(0:siglen-1)*(Fc/siglen) * 5)+ 0.3 * Amp * sin(2*pi*(0:siglen-1)*(Fc/siglen) * 7) ...
  + 1.3 * Amp * sin(2*pi*(0:siglen-1)*(Fc/siglen) * 9)+ 1.4 * Amp * sin(2*pi*(0:siglen-1)*(Fc/siglen) * 11);

%% Estimate the peak value of the signals fundamental using Goertzel algorithm
peak = 0;
indvec = [Fc-1 Fc Fc+1];

% Check the input data
if ~isvector(sig) || isempty(sig)
  error('X must be a nonempty vector')
end

if ~isvector(indvec) || isempty(indvec)
  error('INDVEC must be a nonempty vector')
end
if ~isreal(indvec)
  error('INDVEC must contain real numbers')
end

% forcing x to be column
sig = reshape(sig,siglen,1);

% initialization
no_freq = length(indvec); %number of frequencies to compute
y = zeros(no_freq,1); %memory allocation for the output coefficients

% Computation via second-order system
% loop over the particular frequencies
for cnt_freq = 1:no_freq
  %for a single frequency:
  %a/ precompute the constants
  pik_term = 2*pi*(indvec(cnt_freq))/(siglen);
  cos_pik_term2 = cos(pik_term) * 2;
  cc = exp(-1i*pik_term); % complex constant
  %b/ state variables
  s0 = 0;
  s1 = 0;
  s2 = 0;
  %c/ 'main' loop
  for ind = 1:siglen-1 %number of iterations is (by one) less than the length of signal
    %new state
    s0 = sig(ind) + cos_pik_term2 * s1 - s2;  % (*)
    %shifting the state variables
    s2 = s1;
    s1 = s0;
  end
  %d/ final computations
  s0 = sig(siglen) + cos_pik_term2 * s1 - s2; %correspond to one extra performing of (*)
  y(cnt_freq) = s0 - s1*cc; %resultant complex coefficient

  %complex multiplication substituting the last iterationA
  %and correcting the phase for (potentially) non-integer valued
  %frequencies at the same time
  y(cnt_freq) = y(cnt_freq) * exp(-1i*pik_term*(siglen-1));
end

  % perfom amplitude scaling
  peak = abs(y(2)) * 2 / siglen

% perform parabolic interpolation to get the phase estimate
phase_orig=phase_orig*180/pi
ym1 = angle(unwrap(y(1)));
y0 = angle(unwrap(y(2)));
yp1 = angle(unwrap(y(3)));

p = (yp1 - ym1)/(2*(2*y0 - yp1 - ym1)); 
phase = y0 - 0.25*(ym1-yp1)*p;
phase_est = phase * 180/pi + 90;
phase_est = mod(phase_est+180,360)-180
end

The frequencies you are dealing with (21.3Hz sampled at 8kHz) are very low. Because these are real-valued signals, they will exhibit a bias in phase estimation for ** any** frequency.

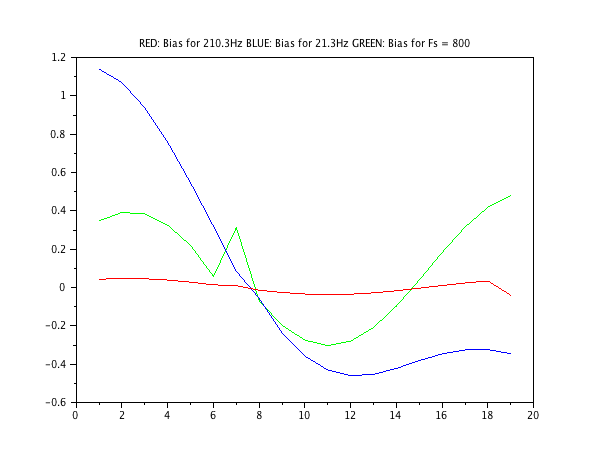
This picture shows a plot of the bias (phase_est - phase_orig) for Fc = 210.3; (in red) versus the bias for Fc = 21.3;. As you can see, the offset is much more significant for the 21.3 case.

Another option is to reduce your sampling rate. The green curve shows the bias for Fs = 800 instead of 8000.

enter image description here

$\endgroup$
12
  • 1
    $\begingroup$ Thanks for the update! See my plot; I still think any phase estimator is going to have a bias for this low a frequency. One way to get around it is to use the known frequency (if it is known!) to correct the phase estimate bias through a look-up table. But you will need to be careful: the bias will change with the frequency. Another way to do it will be to reduce your sampling rate. $\endgroup$
    – Peter K.
    Commented Nov 15, 2013 at 13:37
  • 1
    $\begingroup$ Thank you, too! However, if you are using Fs = 8000 Hz and Fc = 210 instead of 210.3 bias looks even worse. Any idea where this could come from? $\endgroup$
    – lR8n6i
    Commented Nov 15, 2013 at 14:50
  • 1
    $\begingroup$ Erk! No idea. FWIW, the Geortzel estimator doesn't have problems: goertzel = atan(imag(y(2)),real(y(2)))*180/%pi + 90;. :-) Will dig a bit more. Watch this space. $\endgroup$
    – Peter K.
    Commented Nov 15, 2013 at 15:34
  • 1
    $\begingroup$ The parabolic interpolation is not doing what you think it's doing. In particular, if you replace your calculation of p with p2 = (abs(y(3)) - abs(y(1)))/(2*(2*abs(y(2)) - abs(y(3)) - abs(y(1)))); phase2 = y0 - 0.25*(ym1-yp1)*p2; then you get MUCH better answers --- even for Fc=210. I'm not at all sure that the current version of p will give you anything sensible. The interpolation formula is for interpolation of the AMPLITUDE of a parabola, but p i s interpolating the phase which is just... odd. $\endgroup$
    – Peter K.
    Commented Nov 15, 2013 at 15:58
  • 1
    $\begingroup$ All of that is OK, EXCEPT that the peak location (p = (yp1 - ym1)/(2*(2*y0 - yp1 - ym1))) will be incorrect some of the time if you're using PHASES instead of amplitudes. This is because the phases may jump around the +/- 180 degree boundary. All that is needed to fix it for phase is to change that line to my p2 calculation above. $\endgroup$
    – Peter K.
    Commented Nov 15, 2013 at 16:31

Your Answer

By clicking “Post Your Answer”, you agree to our terms of service and acknowledge you have read our privacy policy.

Not the answer you're looking for? Browse other questions tagged or ask your own question.