20
$\begingroup$

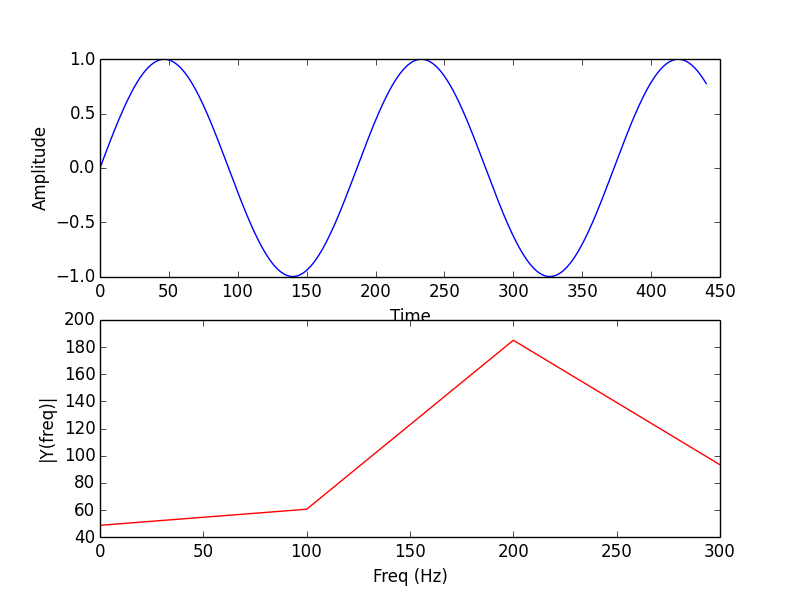
Here is a sinusoid of frequency f = 236.4 Hz (it is 10 milliseconds long; it has N=441 points at sampling rate fs=44100Hz) and its DFT, without zero-padding :

enter image description here

The only conclusion we can give by looking at the DFT is: "The frequency is approximatively 200Hz".

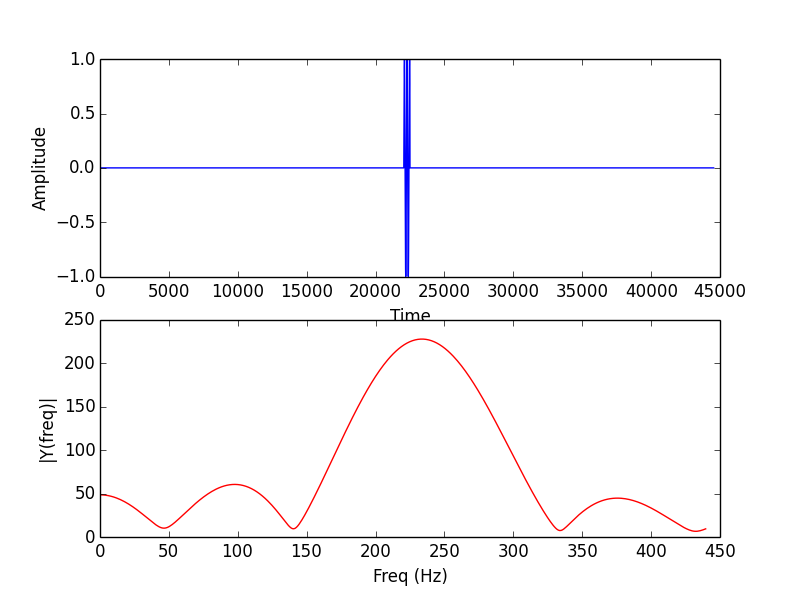
Here is the signal and its DFT, with a large zero-padding :

enter image description here

Now we can give a much more precise conclusion : "By looking carefully at the maximum of the spectrum, I can estimate the frequency 236Hz" (I zoomed and found the maximum is near 236).

My question is : why do we say that "zero-padding doesn't increase resolution" ? (I have seen this sentence very often, then they say "it only adds interpolation")

=> With my example, zero-padding helped me to find the right frequency with a more precise resolution !

$\endgroup$
1
  • 2
    $\begingroup$ Another way to think about this very old question: if you didn't have the time-series plot at all, but only the 'low-res' fft - you could convert it to the time-series, zero-pad, and re-fft to get the 236Hz out. So, the 'low-res' fft must contain all of the same information of the smooth one. $\endgroup$
    – Joshua R.
    Commented Jul 20, 2018 at 21:36

2 Answers 2

25
$\begingroup$

Resolution has a very specific definition in this context. It refers to your ability to resolve two separate tones at nearby frequencies. You have increased the sample rate of your spectrum estimate, but you haven't gained any ability to discriminate between two tones that might be at, for instance, 236 Hz and 237 Hz. Instead, they will "melt together" into a single blob, no matter how much zero-padding you apply.

The solution to increasing resolution is to observe the signal for a longer time period, then use a larger DFT. This will result in main lobes whose width are inversely proportional to the DFT size, so if you observe for long enough, you can actually resolve the frequencies of multiple tones that are nearby one another.

--

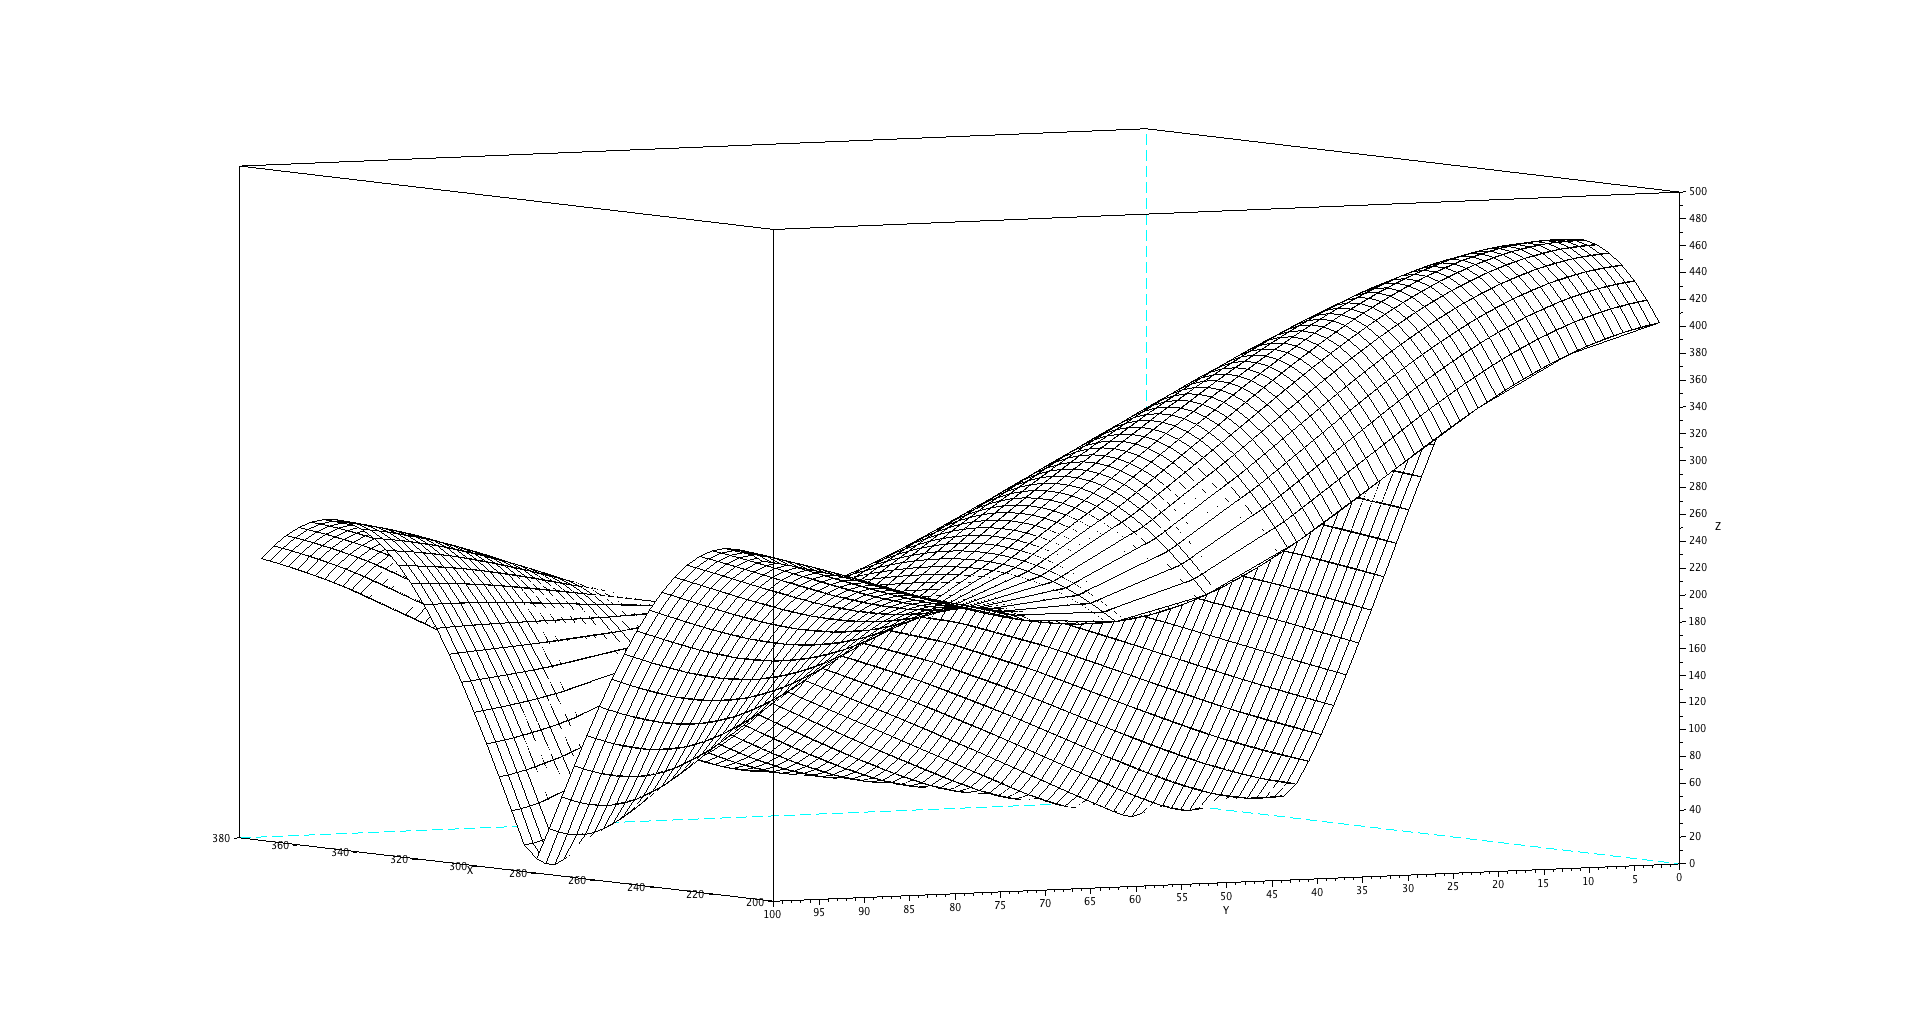
To see how this plays out, here's a plot of the zoomed-in FFT of the addition of two signals: your original sinusoid, and one that differs in frequency from it by 0 to 100 Hz.

It's only towards the 100Hz difference end of the plot (left-hand side here) that you can distinguish (resolve) the two.

Scilab code for generating the plot below.

enter image description here

f = 236.4;
d = 10;
N=441;
fs=44100;
extra_padding = 10000; 

t=[0:1/fs:(d/1000-1/fs)]
ff = [0:(N+extra_padding-1)]*fs/(N+extra_padding);

x = sin(2*%pi*f*t);

XX = [];

for delta_f = [0:100];
    y = sin(2*%pi*(f+delta_f)*t);
    FFTX = abs(fft([x+y zeros(1,extra_padding)]));
    XX = [XX; FFTX];
end

mtlb_axis([0 1300 0 500])

figure(1);
clf
[XXX,YYY] = meshgrid(ff,0:100);
mesh(XXX(1:100,[50:90]),YYY(1:100,[50:90]),XX(1:100,[50:90]))
$\endgroup$
8
  • $\begingroup$ thanks ! ok so zero-padding won't help to resolve two separate tones at nearby frequencies ; however, in my example, it can be useful in order to find the peak of spectrum, and thus find the fondamental frequency of a tone (e.g. for accurate pitch tracking purposes) $\endgroup$
    – Basj
    Commented Nov 8, 2013 at 16:34
  • $\begingroup$ i thought "zero padding doesn't increase resolution" would mean "you cannot do accurate pitch tracking with the help of zero-padding" (that's not true here, the example shows it is possible to detect accurately some pitch) $\endgroup$
    – Basj
    Commented Nov 8, 2013 at 16:35
  • 1
    $\begingroup$ I think you understand correctly. Zero-padding does have its uses, such as in fine estimation of the peak location from a coarse spectrum. It's just not a silver bullet. $\endgroup$
    – Jason R
    Commented Nov 8, 2013 at 16:49
  • 1
    $\begingroup$ I just tried something else than zero-padding, but related. Instead of making x(n) longer (with 0 at the end), I keep x(n) of length N, BUT the change is here : instead of DFT(k) = \sum x(n) exp(-2*i*pi*n*k/N) for k=0,1,...,N-1, I do DFT2(k) = \sum x(n) exp(-2*i*pi*n*k/(10*N)) for k=0,1,...,10*N-1... This is like adding more bins (10 N bins instead of N frequency bins) but keeping the same x(n) of length N. Now the bins would be 10hz, 20hz, ..., 100hz, 110hz, 120hz, ..... => Is it the same than zero-padding: no real additional resolution, but only interpolation? $\endgroup$
    – Basj
    Commented Nov 8, 2013 at 22:34
  • $\begingroup$ Does adding more bins (10N instead of N) : DFT2(k) = \sum x(n) exp(-2*i*pi*n*k/(10*N)) for k=0,1,...,10*N-1 and keeping the same x(n) of length N give the same result than zero-padding : not really more resolution, but only interpolation ? $\endgroup$
    – Basj
    Commented Nov 9, 2013 at 13:35
16
$\begingroup$

The term "resolution" has multiple meanings, which can confuse people trying to communicate when using two different meanings.

In the optical sense, of being able to resolve two nearby clearly separated points (or two adjacent peaks in the spectrum) instead of one blurry blob, zero-padding won't help. This is the meaning most likely being used when stating that zero-padding does not increase resolution.

If one's requirement for resolution requires a dip (for instance a minimum 3 dB lowering) between spectral peaks, then the resolution will be even lower than the FFT bin spacing, e.g. not even Fs/N, but 2X to 3X that, or more, depending on the windowing used. A weaker requirement for resolution might be just the frequency spacing of the DFT's orthogonal basis vectors, e.g. Fs/N.

In terms of plotting points, yes, zero-padding will give you more points to plot, as in DPI (plot points per inch) resolution. That may make it easier to pick out extrema by eyeball. However they are the same points you would get by doing a very high quality plot interpolation (Sinc interpolation) without any zero-padding, so they really add no information that could not be calculated otherwise without the zero-padding.

In terms of pitch tracking, parabolic or Sinc interpolation (interpolation between FFT result bins) of a windowed non-zero-padded FFT result might give you just as good a result as from a more computationally intensive longer zero-padded FFT plot. Thus zero-padding gives you a "better" pitch tracking result than non-zero-padded and non-interpolated peak picking, but often a lot less efficiently than just using interpolation.

If you add noise to your example, but slightly less than the signal, you will find that the zero-padded peak can be just as inaccurate as the non-zero padded peak. So, in the more general case, you may not have found the "right" frequency with any more accuracy than before. Zero-padding only interpolates the inaccurate result due to noise, which another reason why it is said to not increase resolution.
$\endgroup$
6
  • $\begingroup$ Just to remember : what happens if I have the same sinusoid f=236.4 hz during the same 10ms only but with fs=192khz instead of 44.1khz : Will the true frequency resolution be higher then ? $\endgroup$
    – Basj
    Commented Nov 8, 2013 at 23:03
  • $\begingroup$ Increasing the sample rate will give you more high frequency bins, but the same DFT bin spacing near any low frequency of interest, $\endgroup$
    – hotpaw2
    Commented Nov 9, 2013 at 0:06
  • 1
    $\begingroup$ Will increasing the sample rate make the sinc-like curve in DFT narrower or not ? If not, this implies that increasing the sample rate won't add resolution (in the meaning ability to resolve frequencies) $\endgroup$
    – Basj
    Commented Nov 9, 2013 at 13:34
  • $\begingroup$ @Basj Determining a particular frequency of a signal is usually referred to as parameter estimation i.e. you are trying to estimate the frequency parameter. For resolution (separation of 2 tones) the resolution is given by $1/T$ where $T$ is the length of the signal. So just changing the sampling rate (and not the duration) won't affect resolution - it will affect the accuracy of the estimation. $\endgroup$
    – David
    Commented Feb 26, 2014 at 14:43
  • $\begingroup$ The width of the Sinc in frequency is related to the width of the data window in time, zero padding or changing the sample rate doesn't really affect it (other that sampling or quantization issues). $\endgroup$
    – hotpaw2
    Commented Feb 26, 2014 at 17:03

Your Answer

By clicking “Post Your Answer”, you agree to our terms of service and acknowledge you have read our privacy policy.

Not the answer you're looking for? Browse other questions tagged or ask your own question.