2
$\begingroup$

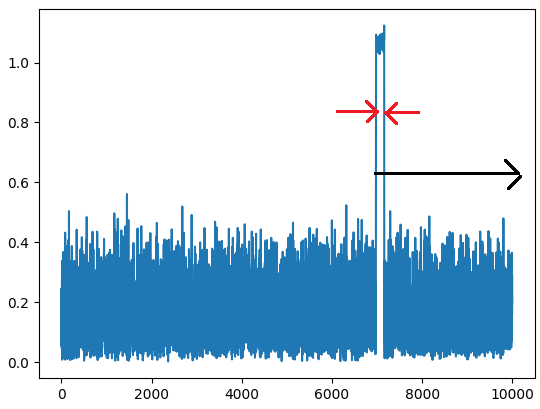
With python scipy I am processing (in real time) chunks of 250,000 each a CW pulsed beep radio signal in python from a RTLSDR. The signal after some basic processing and decimation is 9995 samples long and looks like:

A single chunk with a beep

A "beep" or high state as shown in the image above happens about once every 1,000,000 signals, and I process in chunks of 250,000 (before decimation). A high state has a duration of 189 samples (decimated).

The aim of the project is to:

 (a) Calculate time between beeps (black arrow);
 (b) Calculate beep length (red arrows)

I have tried a few techniques to smooth the signal in the picture (and improve SNR) but they are affecting the downstream calculations.

Moving Average Smoothing:

np.convolve(max_samples, [1]*189, 'valid')/189

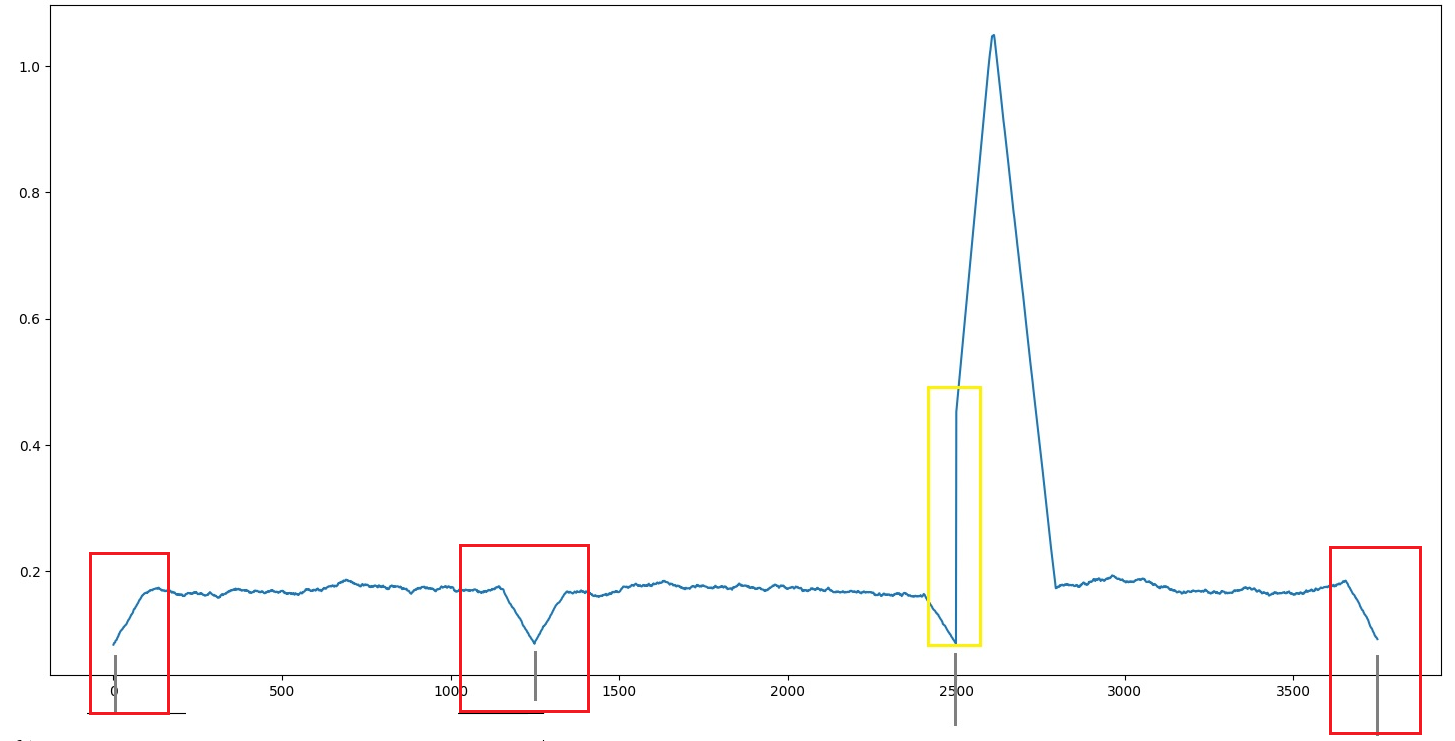
Introduced artifacts on the padding edges, which caused downstream calculations particularly where a chunk edge slices the beginning of a rising edge because the "rising edge" largely disappears and is no longer detected.

padding issues

Savitzky-Golay

https://docs.scipy.org/doc/scipy/reference/generated/scipy.signal.savgol_filter.html#scipy.signal.savgol_filter

signal.savgol_filter(max_samples, 189, 50)

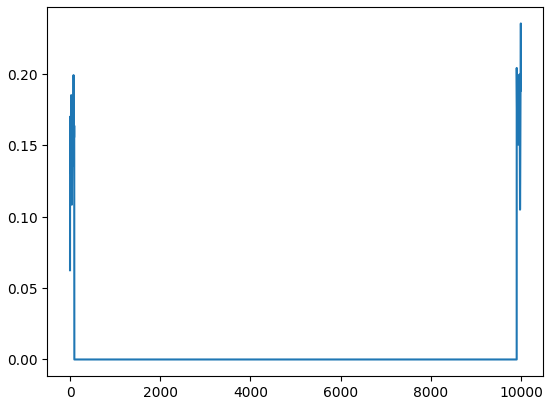
I could not get this filter to output any plot that made sense:

Savitzky Golay

Is there a better way to deal with the smoothing issue, especially as it relates to where a chunk has sliced a beeps rising edge, and still accurately calculating a beeps length?

If the answer is in the Savitzky Golay filter - what are sensible values? When I tried values like:

I get stack error:

-> 630     raise ValueError(
631         "array must not contain infs or NaNs")
632 return a
$\endgroup$
8
  • $\begingroup$ The error says you have nans or infs. Get rid of those (set them to the mean value for example). $\endgroup$
    – Jdip
    Commented Apr 8 at 11:29
  • 1
    $\begingroup$ Are the beeps consistent? I’m asking because in your example, there is a clear threshold over which the beep happens. For this particular example, you could set it at say $0.8$, and the crossings at that threshold define your beep in time… $\endgroup$
    – Jdip
    Commented Apr 8 at 11:31
  • $\begingroup$ Why don't you run this through a simple thresholder? Smoothing will always mess up the edges no matter how you do it. $\endgroup$
    – Hilmar
    Commented Apr 8 at 14:50
  • $\begingroup$ Thats a perfect signal - add noise, and the smoothing is useful in getting the signal out of the noise. (So no the beeps are not always that clear. $\endgroup$
    – Al Grant
    Commented Apr 9 at 1:52
  • $\begingroup$ @jdip I don't know how NaN or Inf get into the max_samples - there is valid numbers in the array. $\endgroup$
    – Al Grant
    Commented Apr 9 at 2:11

1 Answer 1

0
$\begingroup$

As a suggestion, since you know the shape of the beep is a rectangular pulse, take inspiration from image edge detection by computing the unnormalised cross correlation between your signal and a pattern matching the ideal beep edge. This combines edge detection and filtering to increase the signal-to-noise ratio into a single operation to achieve your objectives.

The pattern should consist of -1 for one half and +1 for the other half. You stated that the beep high duration is nominally 189 samples long, but since your objective is to measure this, I presume it must have some variation. The overall pattern length should be no more than twice the shortest duration beep you can guarantee will occur. This pattern weights all points equally, which is ideal for attenuating random noise, with the increase in signal-to-noise ratio being equal to the square root of the pattern length. For example, the pattern might be -1 for 100 samples followed by +1 for 100 samples, which would increase your signal-to-noise ratio by over 14 times.

Rising beep edges will correspond to maxima in the cross-correlation, and the falling beep edges will correspond to minima. Only consider maxima and minima that have an absolute magnitude greater than a threshold you define to reject noise. Using my aforementioned pattern example, and noting that in your plot the beep height is approximately 1, an absolute threshold of 80 might be appropriate given the cross-correlation will result in a value of approximately 100, thus this gives some tolerance for lower height beeps.

$\endgroup$

Your Answer

By clicking “Post Your Answer”, you agree to our terms of service and acknowledge you have read our privacy policy.

Not the answer you're looking for? Browse other questions tagged or ask your own question.