0
$\begingroup$

I am working on the analytic signal concept for observing the frequency variation in the faulted phase current waveform in MATLAB/Simulink model.

In MATLAB/Simulink model, I have used analytic signal block and hilbert's transform method to calculate the real and imaginary components of the faulted phase current.

After that I have used the data for real and imaginary components of the faulted phase current to calculate the magnitude, phase, and instantaneous frequency.

When I plotted the curve between the instantaneous frequency variation vs time for the faulted phase current, I observed that there are high frequency spikes in the curve.

What can be the reason and what is this phenomena called ?

$\endgroup$
2
  • 1
    $\begingroup$ Welcome to SE.SP! Please add a picture of your plot so we can see it a bit more detail what you're seeing. $\endgroup$
    – Peter K.
    Commented Jan 7, 2023 at 14:59
  • $\begingroup$ There's a pretty good question regarding instantaneous frequency here. The $f_9$ formula is the one you wanna look at. This will avoid the spikes you get when the principle argument of phase wraps around. $\endgroup$ Commented Jan 7, 2023 at 19:18

1 Answer 1

2
$\begingroup$

The instantaneous frequency is the time derivative of phase. The time derivative operator is a high pass filter, so it on its own will enhance high frequency noise and attenuate lower frequencies. For example, a step change in time would become an impulse after taking a derivative.

It is possible that the spikes are from "steps" that are incorrectly introduced into the phase during processing; for example if the phase is wrapping at the $2\pi$ boundaries. I suggest reviewing a plot of the phase versus time used prior to taking the derivative and confirm if this phase should be "unwrapped" prior to the derivative operation. (unwrap is a function for doing this in Matlab, Octave and Python scipy.signal).

As a simple example consider the case below of a constant frequency, which would therefore be a ramp in phase. A small amount of noise was added to the phase which is barely visible in the plot of phase versus time, but clear in the demodulated frequency (which was done as a simple difference of phase from sample to sample).

FM Demoduation

If the phase was incorrectly "wrapped" to stay within the range of $\pm pi$, the same demodulator would produce the result as given by the plots below, with very significant negative spikes where the phase wrapping occurred. Even if we did the demodulation with a improved digital differentiator that also filtered the high frequency noise, a significant amount of these spikes would still feed through:
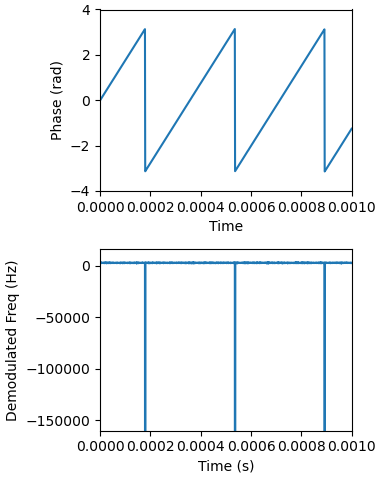
phase wrapping

Not to conclude that phase wrapping is the source of the spikes in the OP's specific case as this is just one obvious / common source for this to occur; any other steps in phase (from actual noise sources) would also lead to spikes in the demodulated signal.

As a side-comment: this high frequency noise enhancement is a common 'feature' in FM demodulation, and is the reason for the use of pre-emphasis in some FM modulation implementations.

$\endgroup$
4
  • $\begingroup$ Can you share a research paper (journal or conference paper) where this answer is written. I have to study more about it. $\endgroup$ Commented Jan 9, 2023 at 8:11
  • $\begingroup$ @SiddharthKamila These are some basic signal processing concepts so not sure I can located a research paper about this specifically- but what part confuses you? The phase wrapping or that instantaneous frequency is the time derivative of phase? Or that a time derivative is a high pass filter? $\endgroup$ Commented Jan 9, 2023 at 12:48
  • $\begingroup$ This may help you: en.wikipedia.org/wiki/Instantaneous_phase_and_frequency and to see how the derivative is a high pass filter, review the Laplace Transform of the time derivative: The Laplace of $d/dt x(t)$ is $sX(s)$. To get the frequency response replace $s$ with $j\omega$, and thus the result is $\omega X(\omega)$. $\endgroup$ Commented Jan 9, 2023 at 12:51
  • $\begingroup$ As far as the phase wrapping itself, phase wrapping produces steps in phase (as demonstrated in my answer). A derivative of a step is an impulse: consider the case of a discrete time differentiator which estimates a derivative given as $y[n]=x[n]-x[n-1]$ and what you would get for the output of that if there was a big step in time. $\endgroup$ Commented Jan 9, 2023 at 12:59

Your Answer

By clicking “Post Your Answer”, you agree to our terms of service and acknowledge you have read our privacy policy.

Not the answer you're looking for? Browse other questions tagged or ask your own question.