2
$\begingroup$

I have the following code block. Im just trying to calculate the periodogram of the signal $x$ with a built-in periodogram function and without any built-in periodogram function. I get the same pattern but the amplitudes are not equal. What am I missing there?

clear
close all
j = sqrt(-1);
n = 1:1:256;
noise_mean = 0;
noise_deviation = sqrt(5);
noise = noise_deviation.*randn(1,256) + noise_mean;
x = 20*exp(j*2*pi*(0.15)*n) + 30*exp(j*2*pi*(0.20)*n) + noise;
N = length(x); % N point FFT
for k = 1:N 
    Sx(k) = 0;
    for n = 1:N
        Sx(k) = Sx(k)+x(n)*exp(-1i*2*pi*(k-1)*(n-1)/N);
    end
end
Sx = (1/N)*abs(Sx).^2;
figure
plot(10*log10(Sx)) , title('Periodogram without Built-in');
figure
plot(10*log10(periodogram(x))), title('Built-in Periodogram');

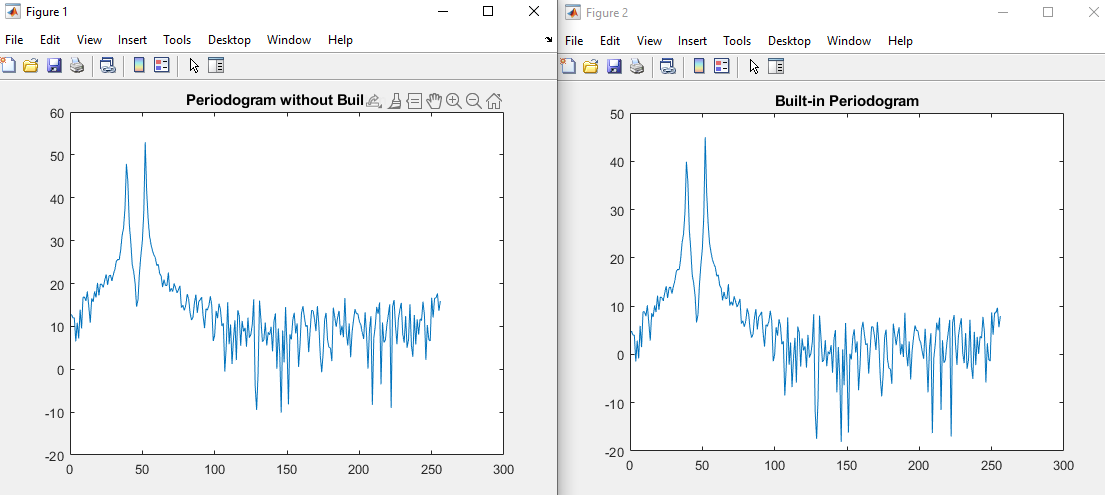
enter image description here

$\endgroup$

1 Answer 1

1
$\begingroup$

Because by default Matlab scales the periodogram by $1/f_s$ to get the Power Spectral Density, $f_s$ being the sampling frequency.

If $f_s$ is not supplied in the call to periodogram, it uses the normalized frequency $2\pi$ to scale the squared magnitude: $$\frac{1}{2\pi}|X[k]|^2$$

Sx = 1/(2*pi*N)*abs(Sx).^2;
$\endgroup$
2
  • $\begingroup$ When I use Sx = 1/(2*pi*N)*abs(Sx).^2; the difference between periodogram and manual-calculated periodogram is 10 dB. I just wrote Sx as above, nothing changed in my code. $\endgroup$ Commented Dec 25, 2022 at 10:09
  • $\begingroup$ @dorottopunto93 Check again, on my end I get the same exact result for Sx and periodogram(x). I am using your code. $\endgroup$
    – Jdip
    Commented Dec 25, 2022 at 10:17

Your Answer

By clicking “Post Your Answer”, you agree to our terms of service and acknowledge you have read our privacy policy.

Not the answer you're looking for? Browse other questions tagged or ask your own question.