6
$\begingroup$

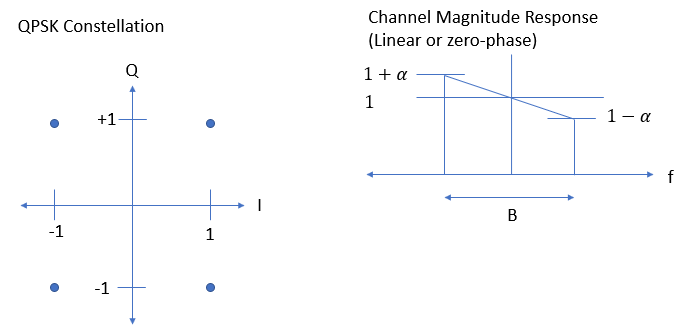
What is the effect of a passband slope on a QPSK (or any QAM) constellation? Specifically given a linear slope (in magnitude, not dB), and no phase distortion (linear phase or even zero-phase) how would the following constellation appear after being passed through such a channel?

constellation and channel response

This is a "DSP Puzzle". Please preface your answer with "spoiler" notation by typing the following two characters first ">!" (see other DSP Puzzle tagged questions for examples of what this means and does). Please do not confirm or get to your result with a simulation but post your best conjecture. An analysis is allowed and welcomed but not required. I am looking for the simplest intuitive explanation as to what the resulting shape, line or curve would be for the resulting samples in the constellation with a quantified range related to the slope in the channel ($\alpha$).

It is common to get a passband slope in wide-band single-carrier solutions (D/A converter Sinc with digital IF, analog filters, amplifiers and transmission lines). Recognizing this possible distortion source from the constellation alone is a useful signal forensics tool.

Here are additional simplifying assumptions:

  • The QPSK waveform is perfectly pulse shaped to have an occupied bandwidth $B$ with a rectangular magnitude shape in the frequency domain, and the data is independent and randomly distributed uniformly over all symbols in the constellation. The waveform as created prior to the channel distortion has zero inter-symbol interference (ISI).

  • I am not looking for detailed distributions, EVM, etc, just what the final shape would be after many, many symbols.

  • You need not know anything else about the receiver. In this case all pulse shaping is done for zero ISI at the transmitter to achieve the constellation as shown with no other noise added or subsequent processing.

If this helps to clarify, consider the perfect root-raised cosine waveform at the transmitter in cascade with the perfect root-raised cosine matched filter that would normally be in the receiver which together would provide the desired zero-ISI raised cosine response and for a band-limited signal. This would have the constellation as shown when that waveform is sampled at the optimum symbol sampling locations in time. In this case the pulse shaping filter is an infinite duration Sinc function with scaled complex impulses at the input representing the desired QPSK symbols for a random stream of symbols. The result would be a rectangular magnitude B Hz wide for a symbol rate of B Symbols/sec.

Adding some hints since this hasn’t been answered yet:

  • This is a good exercise is some fundamental properties of the Fourier Transform, in particular decomposing the passband into even and odd functions.

  • As far as the distribution; familiarity with the Random Harmonic Series is helpful, in particularly a two-sided one (which I am not sure has a formal name).

$\endgroup$
8
  • $\begingroup$ "perfectly pulse shaped": I take this as "$B$ is half the symbol rate", right? $\endgroup$ Commented Oct 7, 2022 at 15:24
  • $\begingroup$ The twitters are pointing out that for defining what the constellation at the receiver looks like, we need to define the receive "integrator" / filter + sampler. Otherwise there's an RX signal, but not an RX constellation. $\endgroup$ Commented Oct 7, 2022 at 16:26
  • 1
    $\begingroup$ @MarcusMüller B is the symbol rate for an infinite duration Sinc filter as the pulse shape and the constellation will be the samples at the ideal sample clock timing location, on that same waveform. It needn’t be more complicated as having to consider a receiver etc- pretend it is at the transmitter except you used a RC filter instead of RRC and a perfect one at that (which is the Sinc impulse response with an impulse representing each symbol at its input) $\endgroup$ Commented Oct 7, 2022 at 16:43
  • $\begingroup$ And didn’t realize there is a twitter back-channel! And suggesting my question may be ill-posed missing some unstated assumptions. I will try to incorporate my last comment into the assumption list. $\endgroup$ Commented Oct 7, 2022 at 16:48
  • 1
    $\begingroup$ I felt bad for opening a back-channel without telling you ;) it's the utmost delightful discussion I'm having with Daniel there. $\endgroup$ Commented Oct 7, 2022 at 16:50

2 Answers 2

1
$\begingroup$

! See the graphic below showing the described frequency response decomposed into even and odd functions: freq response
The formula given for the odd component is simply derived from the linear slope we have in frequency. We note two important Fourier Transform properties at this point:

Property 1: A real even function in one domain will be a real even function in the other domain.
Property 2: A real odd function in one domain will be an imaginary odd function in the other domain.

In our decomposition we have a real component that meets the Nyquist Zero-ISI criterion so itself will have zero ISI, and map to an impulse response in time that is completely real. The odd component however does not meet this Criterion so will contribute ISI, and importantly that related impulse response will be completely imaginary.

At this point, we see how the passband slope will lead to a quadrature distortion for a QPSK / QAM waveform, leaking energy from I to Q and from Q to I.

(Answer is in process.. I need to return to this later)

$\endgroup$
0
$\begingroup$

Having seen this exact thing happen during development of a QPSK modem in hardware, this will most likely result in ISI and you'll see an interesting phenomenon where each constellation point looks like a mini grid of points (i.e. the symbol gets binned into little groups around the ideal value). (Edit: thinking about this more, the above may be a special case - I'm remembering i've also seen ISI in constellations that cause the symbols take on a more diagonal line-like shape which could be the 'usual effect')

I rationalized this effect in the past happening by thinking about how the filter affects the various symbol transitions. E.g. consider the case where you have a burst of the same symbol back to back versus a transition to the 180 deg out of phase symbol. In the first case, the symbols in the middle of the burst will not be significantly altered by the low pass filter and thus will show up in one similar bin on the constellation. In the second case, the symbol points prior and after the transition will both be affected by the filter (due to ISI) and thus end up in bins slightly perturbed from the ideal point. It's of note this won't just average to an awgn blob (at least in high enough snr) due to the mean of each of the symbol transitions always ending up in their same respective bin based on the symbols around them.

Not the most coherently written thing but good enough for now. I will think about the effect of alpha some more and edit later.

$\endgroup$
1
  • $\begingroup$ Good start and looking forward to your update! $\endgroup$ Commented Oct 7, 2022 at 20:14

Your Answer

By clicking “Post Your Answer”, you agree to our terms of service and acknowledge you have read our privacy policy.

Not the answer you're looking for? Browse other questions tagged or ask your own question.